Price Indices – February 2012
There can be little doubt about what the coolest aspect of EVE is. Inflation, money supply and the velocity of money is where it‘s at, right? Well, that‘s what this blog is about.
Three of four main price indices show considerable inflation in February, ranging from 1.4% for the Consumer Price Index to 8.1% for the Mineral Price Index. This inflation has been evident since last August. Many have suggested that this is caused by the rewards coming from Incursions.
There‘s certainly a lot of money coming from Incursions. Incursion rewards in December amounted to 9.6 trillion ISK, which is an all time high, while the rewards in January and February were 9.0 and 8.7 trillion ISK respectively. That‘s quite a bit of money entering the economy. However, Incursions are not the biggest ISK faucet, bounties are. Bounty prizes paid out in February totalled 33 trillion ISK.
The following graph shows the development of the Consumer Price Index and and the money supply per subscriber. The money supply is shown as an index to facilitate comparison.
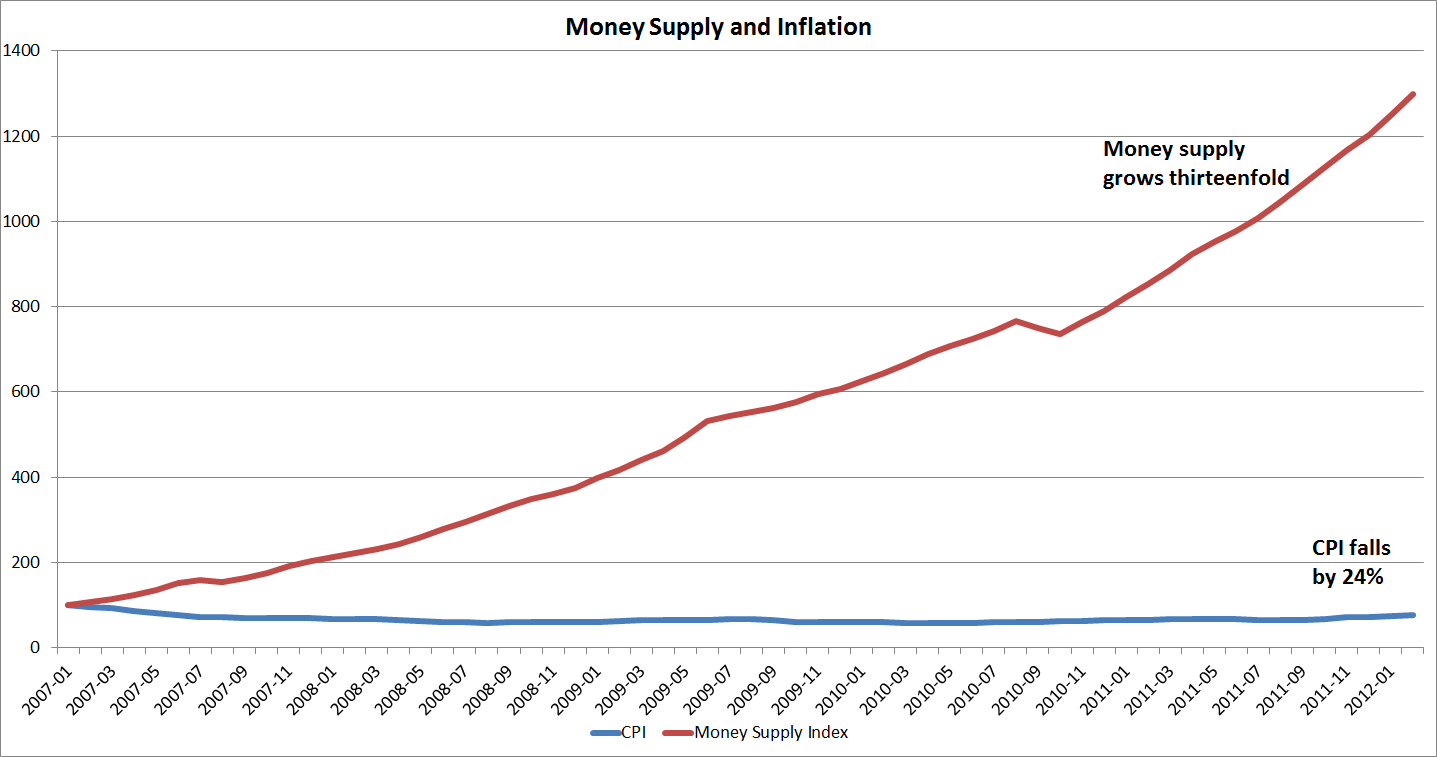
Changes in the money supply dwarf the changes to prices. While the money supply grew more than thirteenfold, the CPI fell by almost a quarter. It‘s clear that these series aren‘t strongly correlated. The existence of money alone doesn‘t contribute much to inflation. Money that isn‘t being spent won‘t affect prices. This brings us to the concept of the velocity of money, i.e. frequency with which a given quantity of money changes hands in transactions. It can be stated as the total value of all transactions in a period, divided by the money supply. In our case, we shall be using monthly measurements, i.e. market transactions per month divided the average money supply that month. Only transactions on the general market are included. Transactions through contracts, direct trade and loyalty point stores are excluded. The following figure compares the monthly velocity of money to the Consumer Price Index.
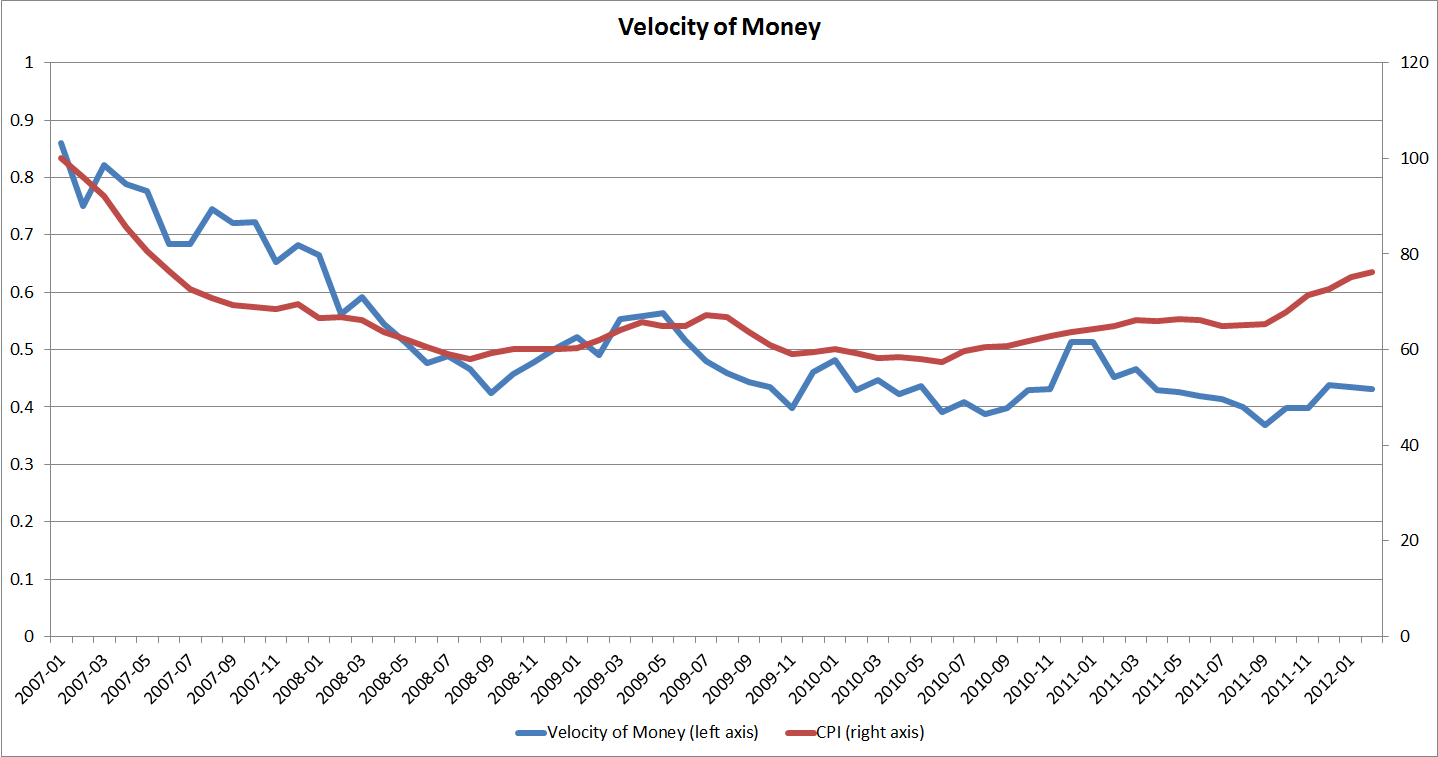
Here we see a proper correlation between the two series, at least until year 2009. The velocity of money falls steeply and steadily from the start of the graph, January 2007, until late 2008. This is happening at a time when the money supply was growing. As the increased money supply wasn‘t increasing trade to the same degree, the result was a lower velocity of money. An important factor in this was probably the absence of a trusted banking sector, which could offer interest and distribute the unused ISK to those in need of funds. It‘s also important to note that money supply and the velocity of money are far from being the only things that affect inflation. Supply side changes can have a big impact on prices. This was the case in 2007 when Invention was introduced to Tech II production, which dramatically reduced Tech II prices.
The correlation between the velocity of money and the CPI seems to change by the end of 2008. From January 2007 to October 2008, the correlation between the two series is 0.86, which is quite strong for a non-academic case like this one. From November 2008 to February 2012 the correlation is -0.01, which is just about as uncorrelated as possible. So, what happened in November 2008? PLEX was introduced. PLEX seems to increase the velocity of money in the New Eden economy as it “liberates“ ISK from people with more money than they know what to do with and gets it to ISK needy people that create and sell PLEX.
Obviously, the intricacies of the mechanics behind inflation are far more complex than described here, as evidenced by the vast literature and the various schools of thought on the subject. We may dive deeper into this in the future, but for now we‘ll just put it out there for discussion.
As previously mentioned, three of four main price indices measured considerable inflation last month. This inflationary trend is most likely driven from the demand side, as suggested by increasing velocity of money, but also by generally increased activity within EVE. More jumps are being made, more missions being run, more PvP kills are being made and so forth. But where such happy times roam, inflation tends to follow.
The index values for February are:
|
February 2012 |
1 Month Change |
12 Month Change | |
|
Mineral Price Index |
87.7 |
5.2% |
20.8% |
|
Primary Producer Price Index |
88.2 |
4.3% |
22.3% |
|
Secondary Producer Price Index |
116.8 |
1.6% |
6.1% |
|
Consumer Price Index |
75.1 |
3.4% |
16.7% |
The following graph shows the development of the indices since October 2003.
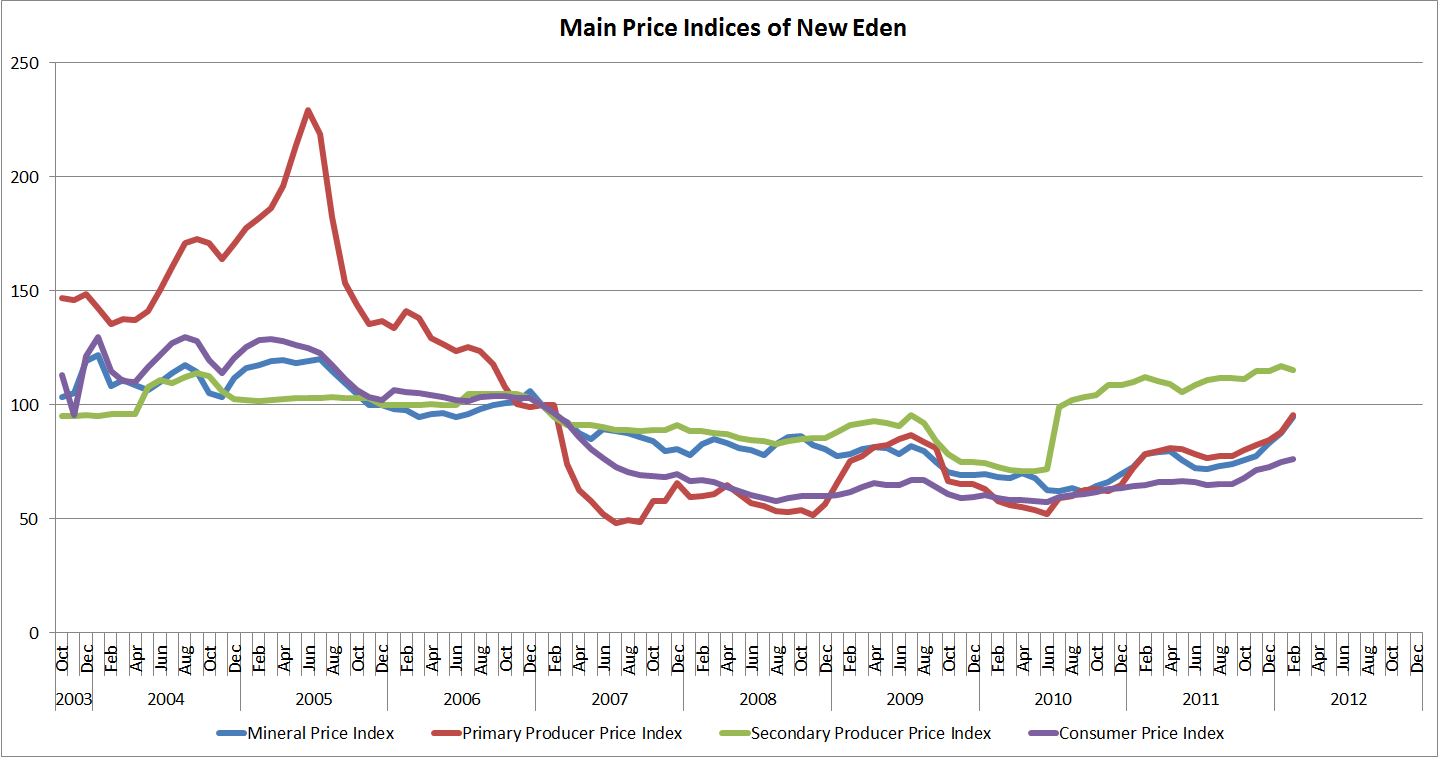
The only index showing deflation in February is the Secondary Producer Price Index. The reason for this is a fall in the prices of goods from Planetary Interaction, which outweighs the inflationary effect from other product categories. This fall comes as the market settles down after period of rapid rise in the price of PI made goods. This rise was caused by uncertainty and increased cost for PI production, following the announcement and implementation of player-owned customs offices.
For more detail on the indices, please refer to the Market Indices page on Evelopedia.
Full series of the four main price indices in Excel format
Full series of the four main price indices in CSV format
Catch CCP Recurve and his economical friends at Fanfest 2012! More information on Fanfest topics, tickets and travel can be found here. Staying at home? Then don't forget the EVE TV Live Stream!
New to EVE? Start your 14-day free trial today.
Returning pilot? Visit Account Management for the latest offers and promotions.