EVE Economy Update - EVE Vegas 2015 Report
In EVE Vegas I presented a lot of data we've either rarely or never made public before. This also meant a lot of new graphs, often complex ones that in hindsight are not very suitable to fit into a 30 minute presentation at the 3rd day of EVE Vegas. In this devblog I will go through all the graphs presented and the details behind them. FYI for the data science minded: Every single graph is made procedurally in R with the ggplot2 package, with no post-processing done what so ever. All line-graphs have the same theme; the daily series is a thin barely visible line, with the thick line representing a 30-day moving average.
Many players rely on daily Peak Concurrent Users (PCU) numbers to estimate activity in EVE Online since PCU is the only official number that is available for players to see, e.g. on Chribba's eve-offline.net, but here is a graph showing the 30 day moving average of it since Aug 2012:
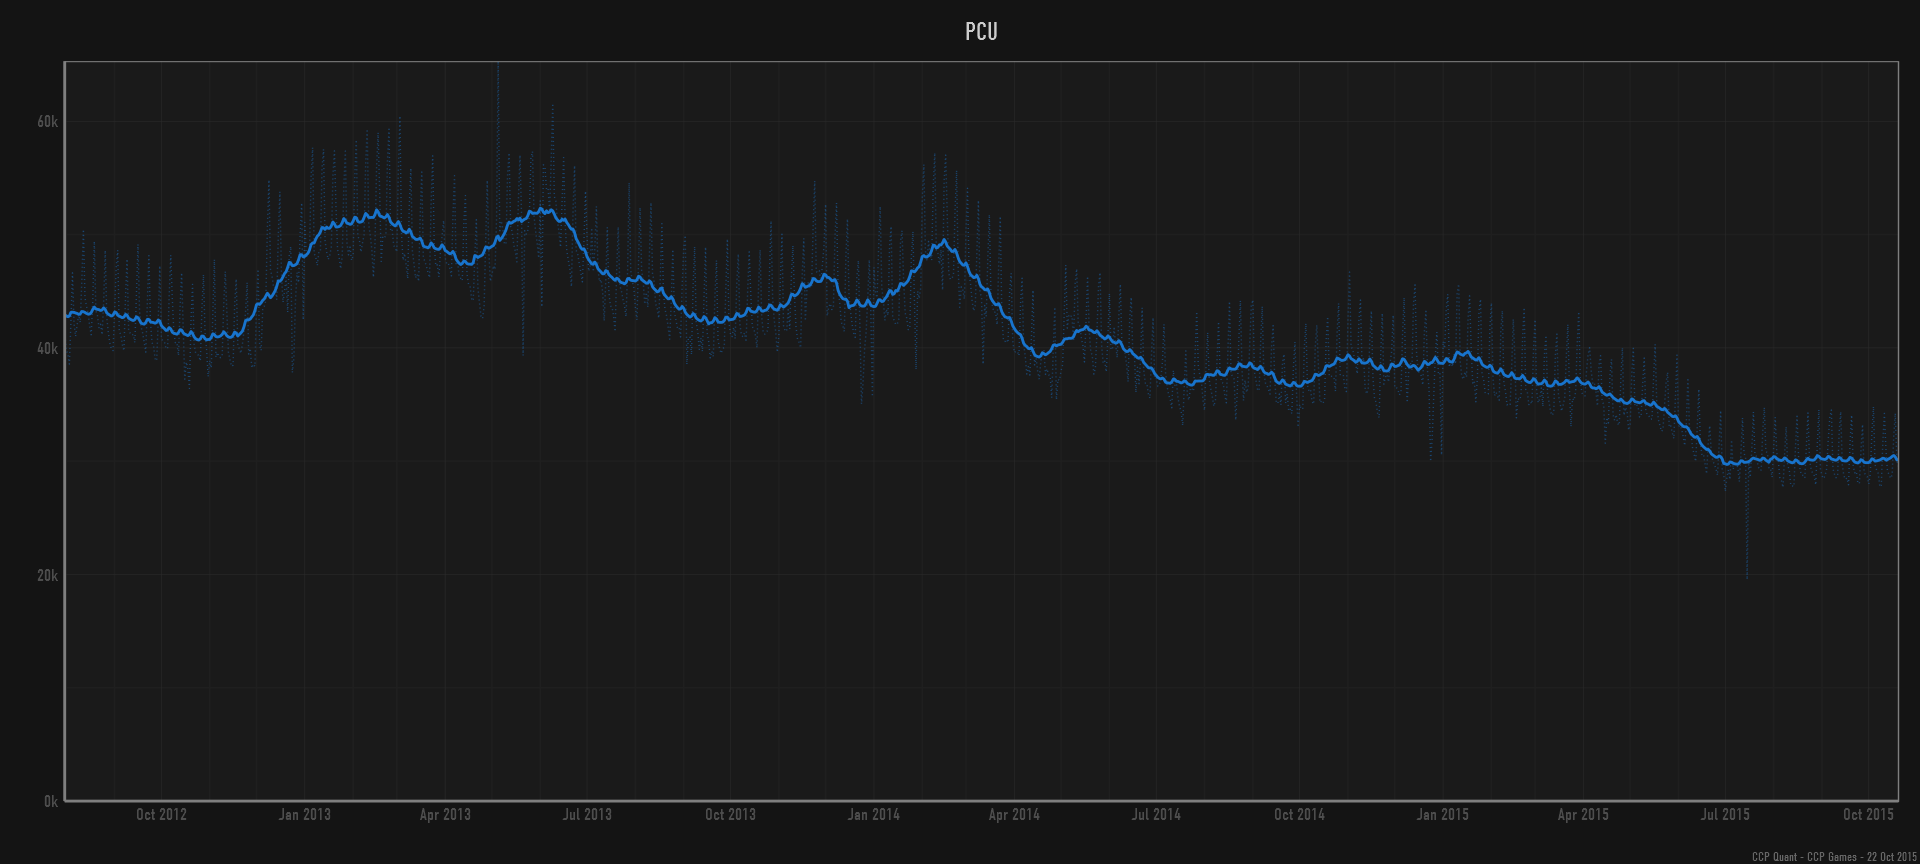
While EVE PCU has been declining a bit for the past two years for various reasons, e.g. skillqueue changes, I wanted to give you a glimpse into actual activity numbers and the state of the EVE Online economy.
First to summarize what players are doing when they log in, these are just some semi-random events I took from our logs:
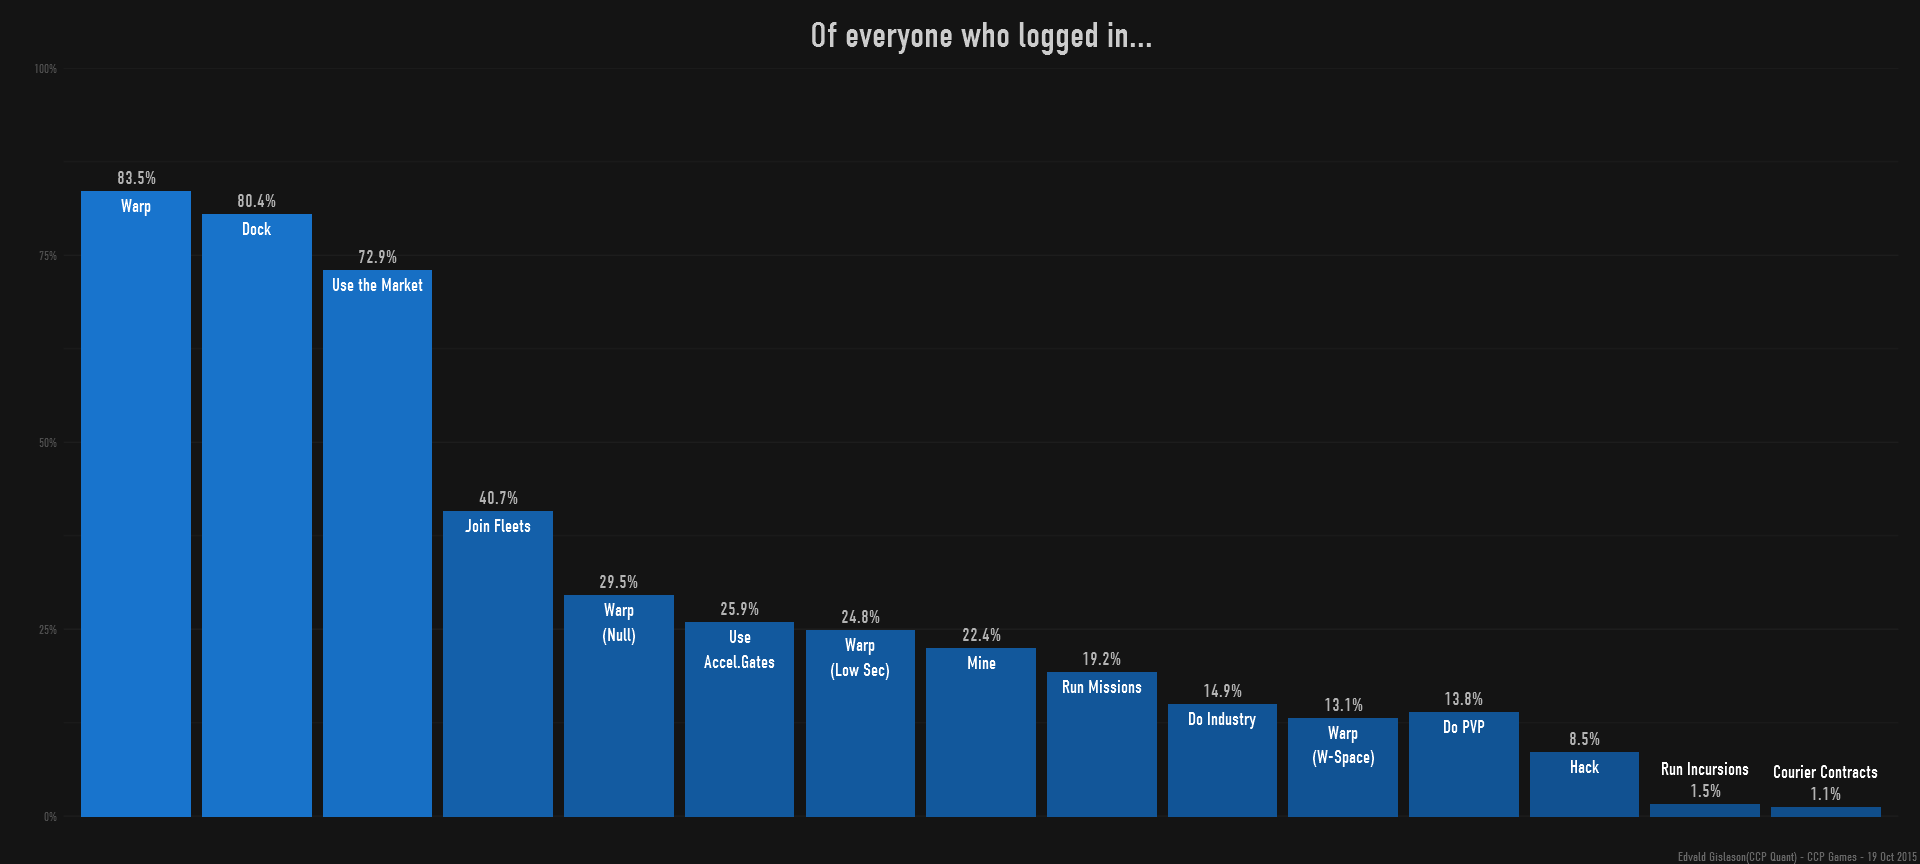
It's good to see that so many of you going out of the stations to get some fresh air, the market is used heavily of course, which fuels devblogs like this one to happen.
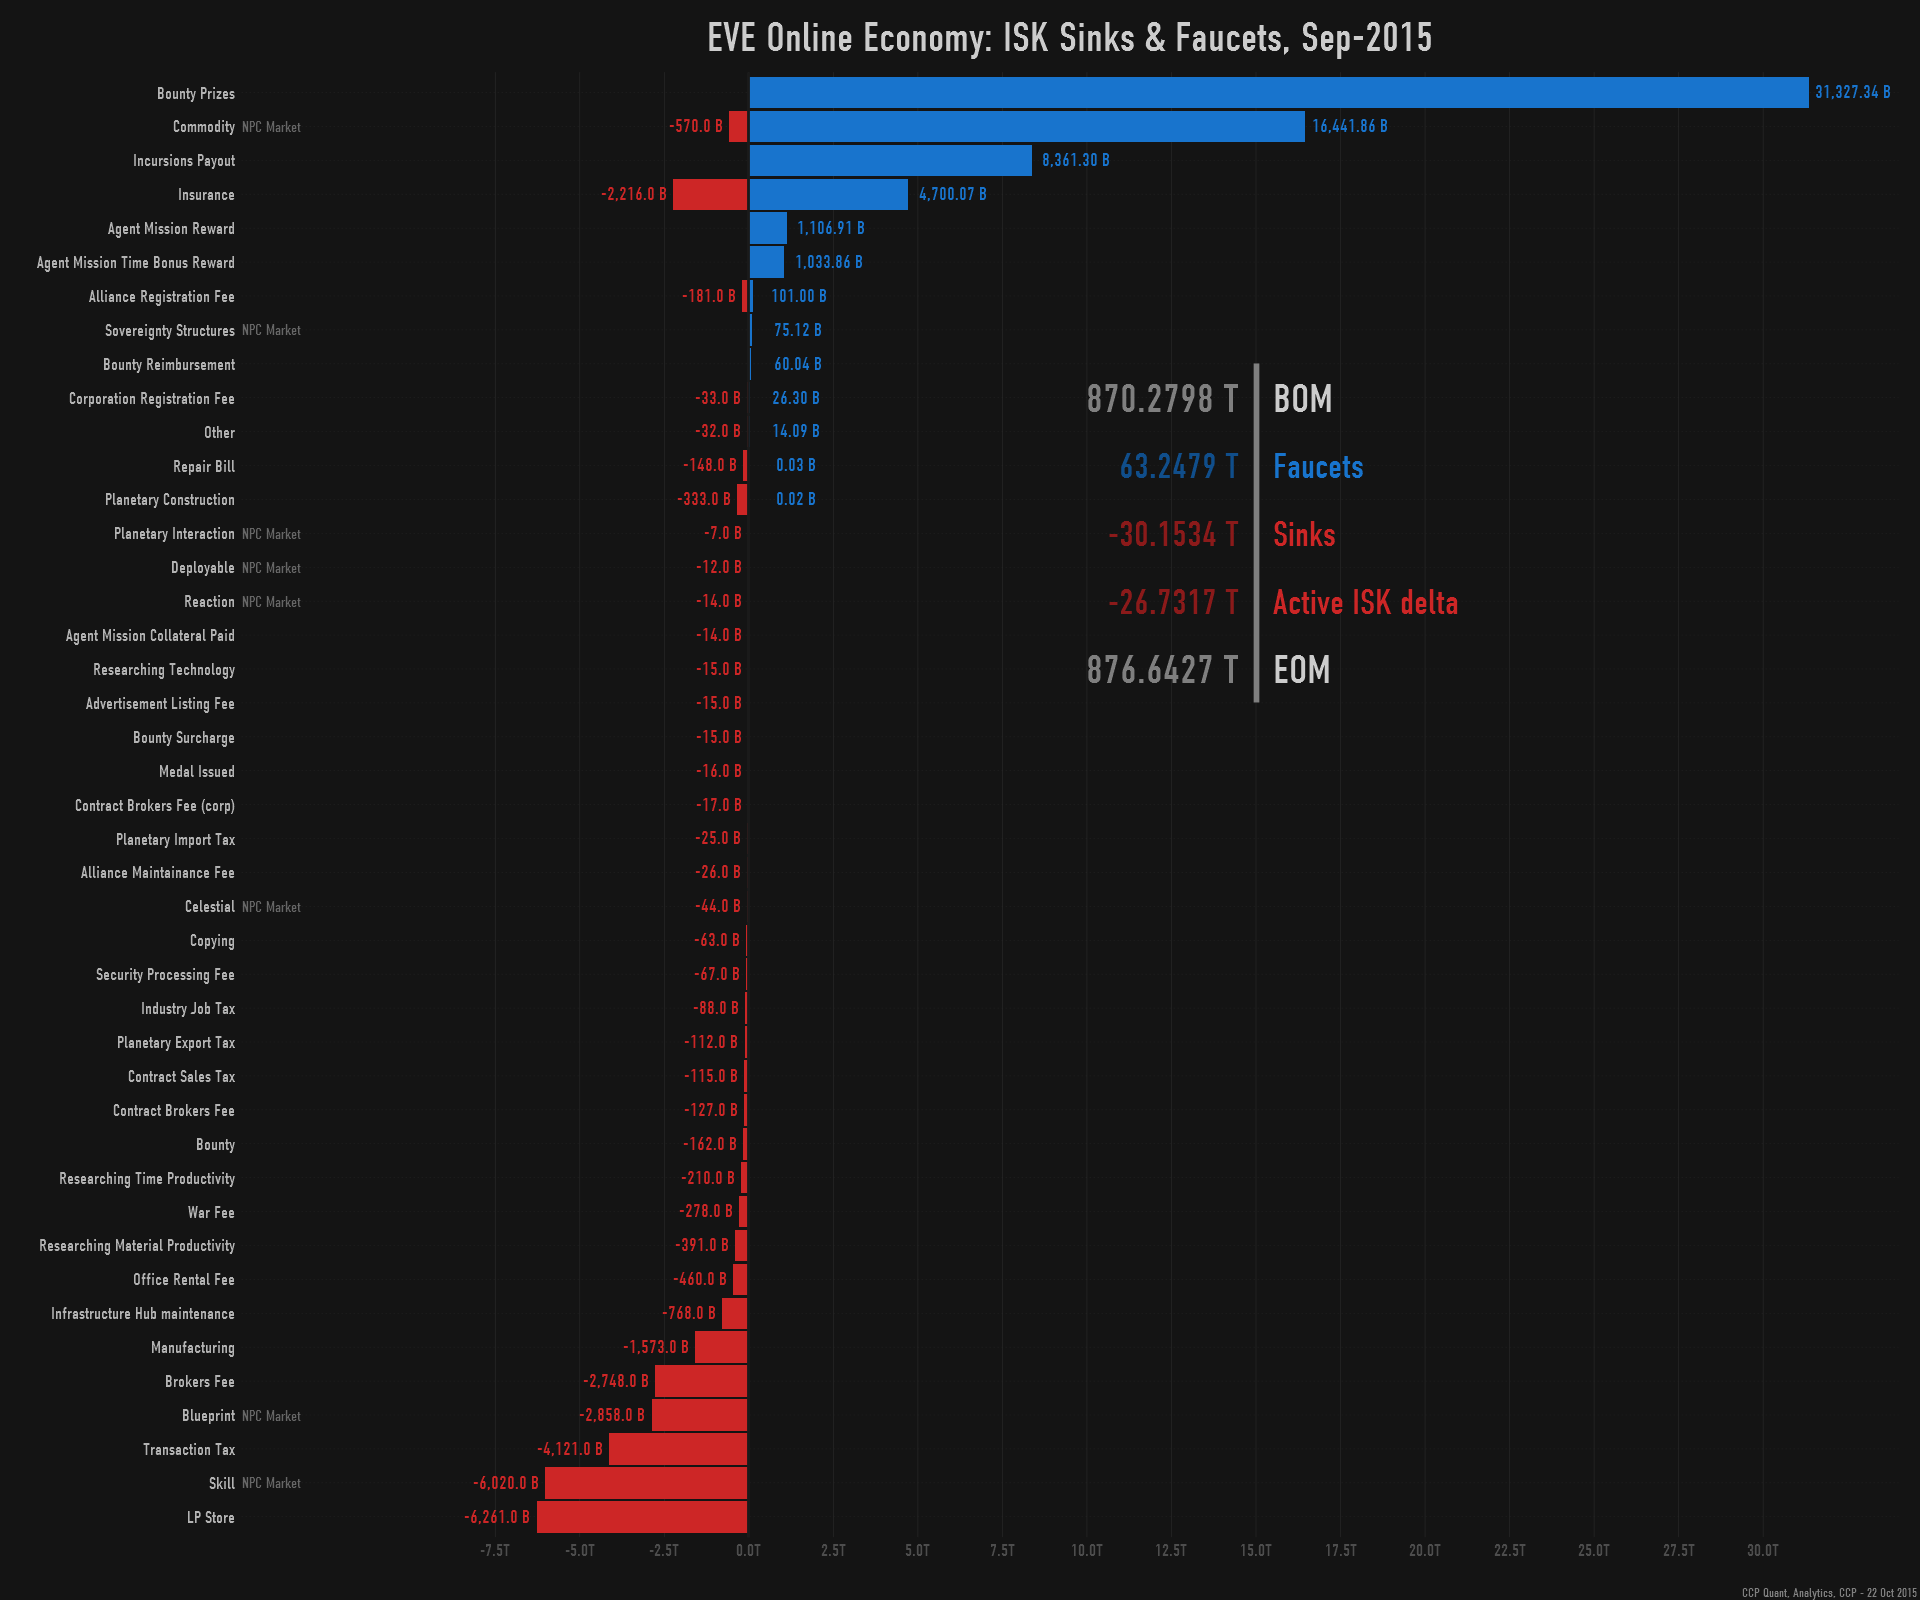
You can see some interesting and unexpected things like the fact that only 1.5% of players run Incursions and 13.8% of players engage in PVP on any given day. The former is especially interesting considering the fact that incursion payouts were the 3rd largest ISK faucet in September, at 8.3T ISK, which you'll see this later in this blog, and on top of this is the added value of Concord LP payouts for clearing incursions.
Moving on to Production and Destruction in EVE, here is a graph showing the total value destroyed (orange) vs. the total value of end products(e.g. excluding components) produced (blue):
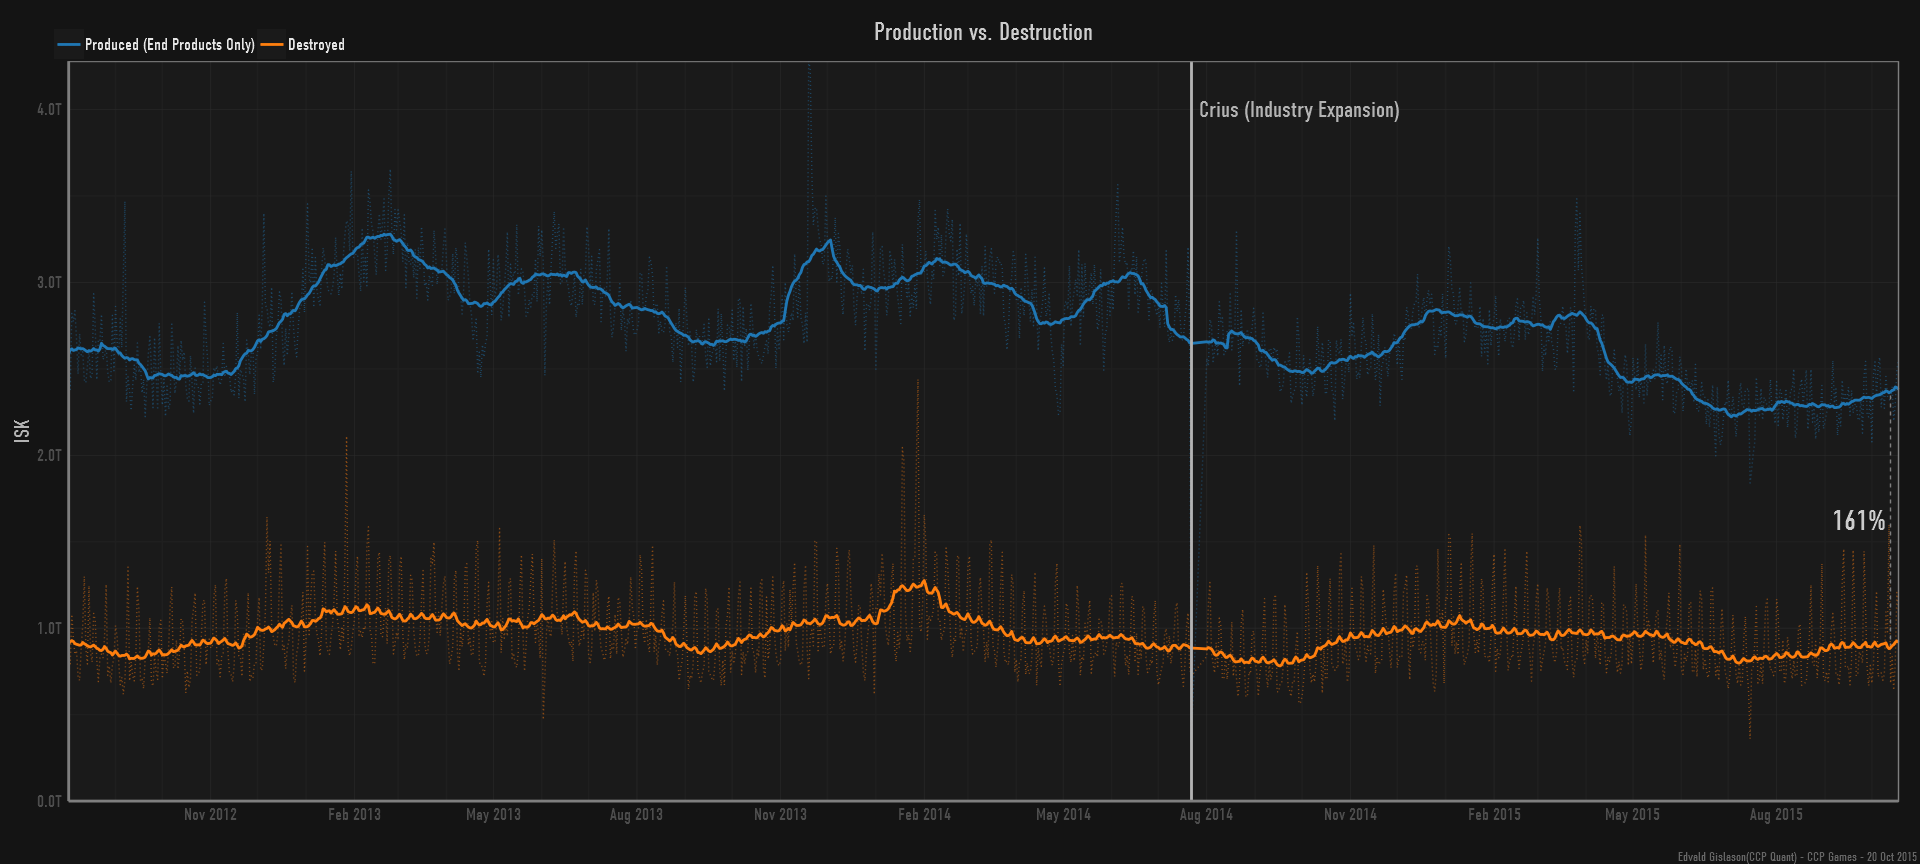
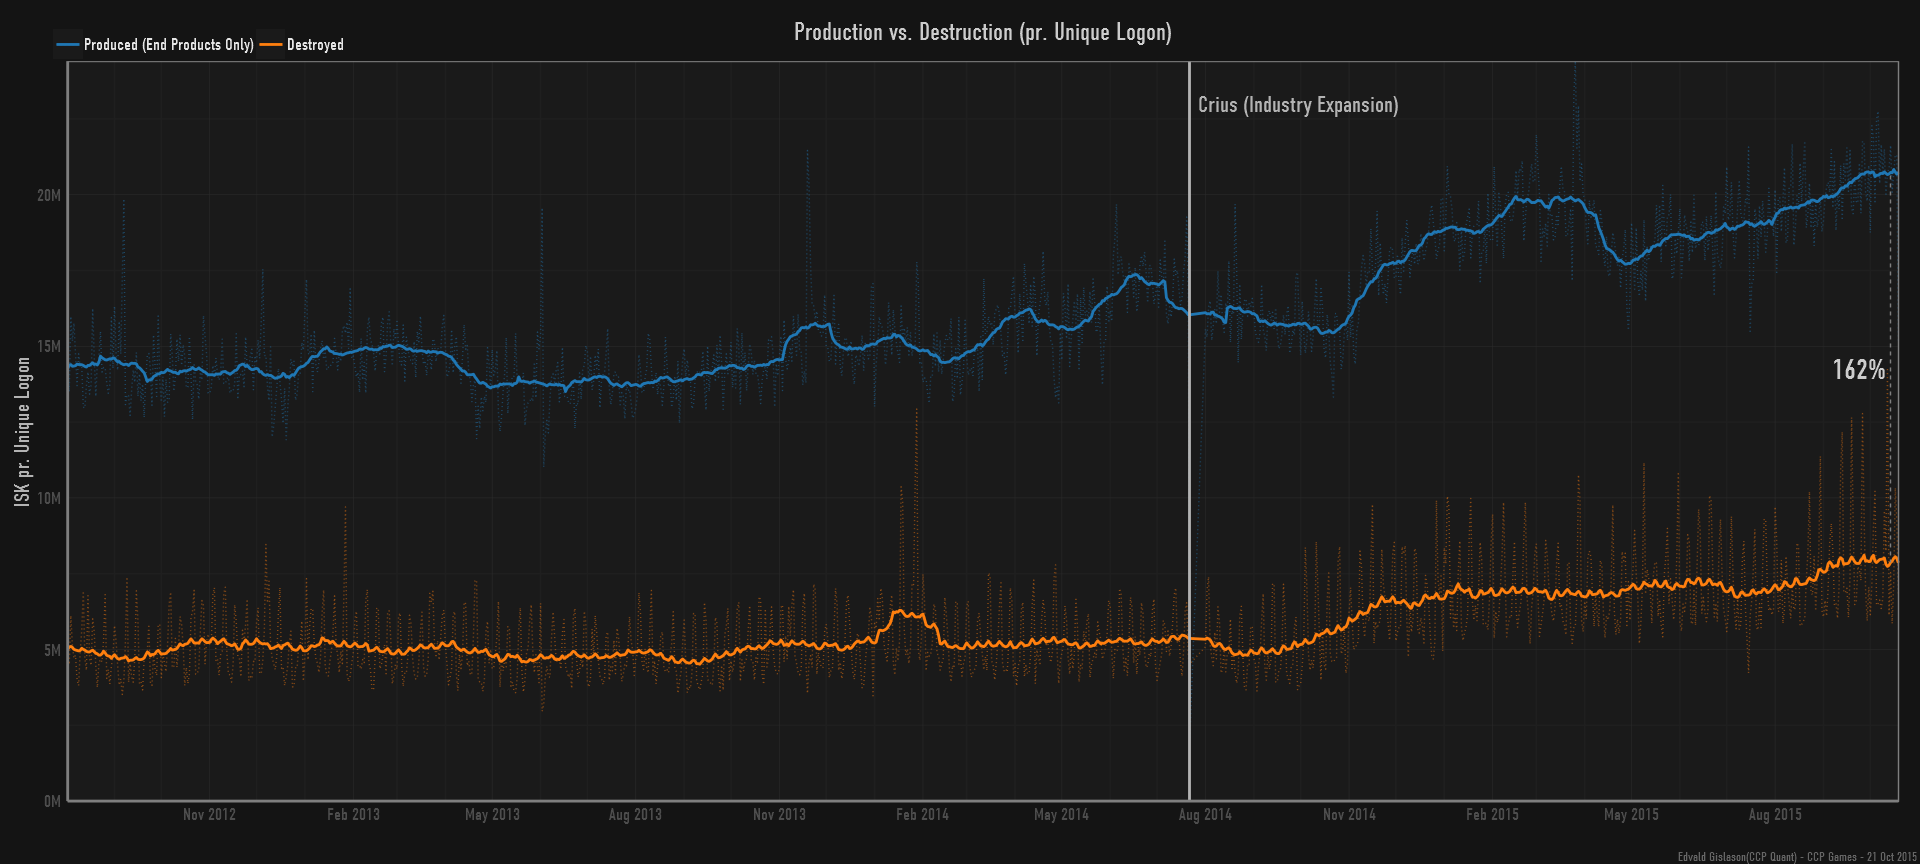
Here you can see that, contrary to some conclusions that can be drawn from the PCU graph, activity is not going down overall. If we normalize it by unique logons, we rather see those numbers increasing, meaning that those playing now contribute relatively more to the sandbox than the general population in the previous years, which is a great sign:
Regional data
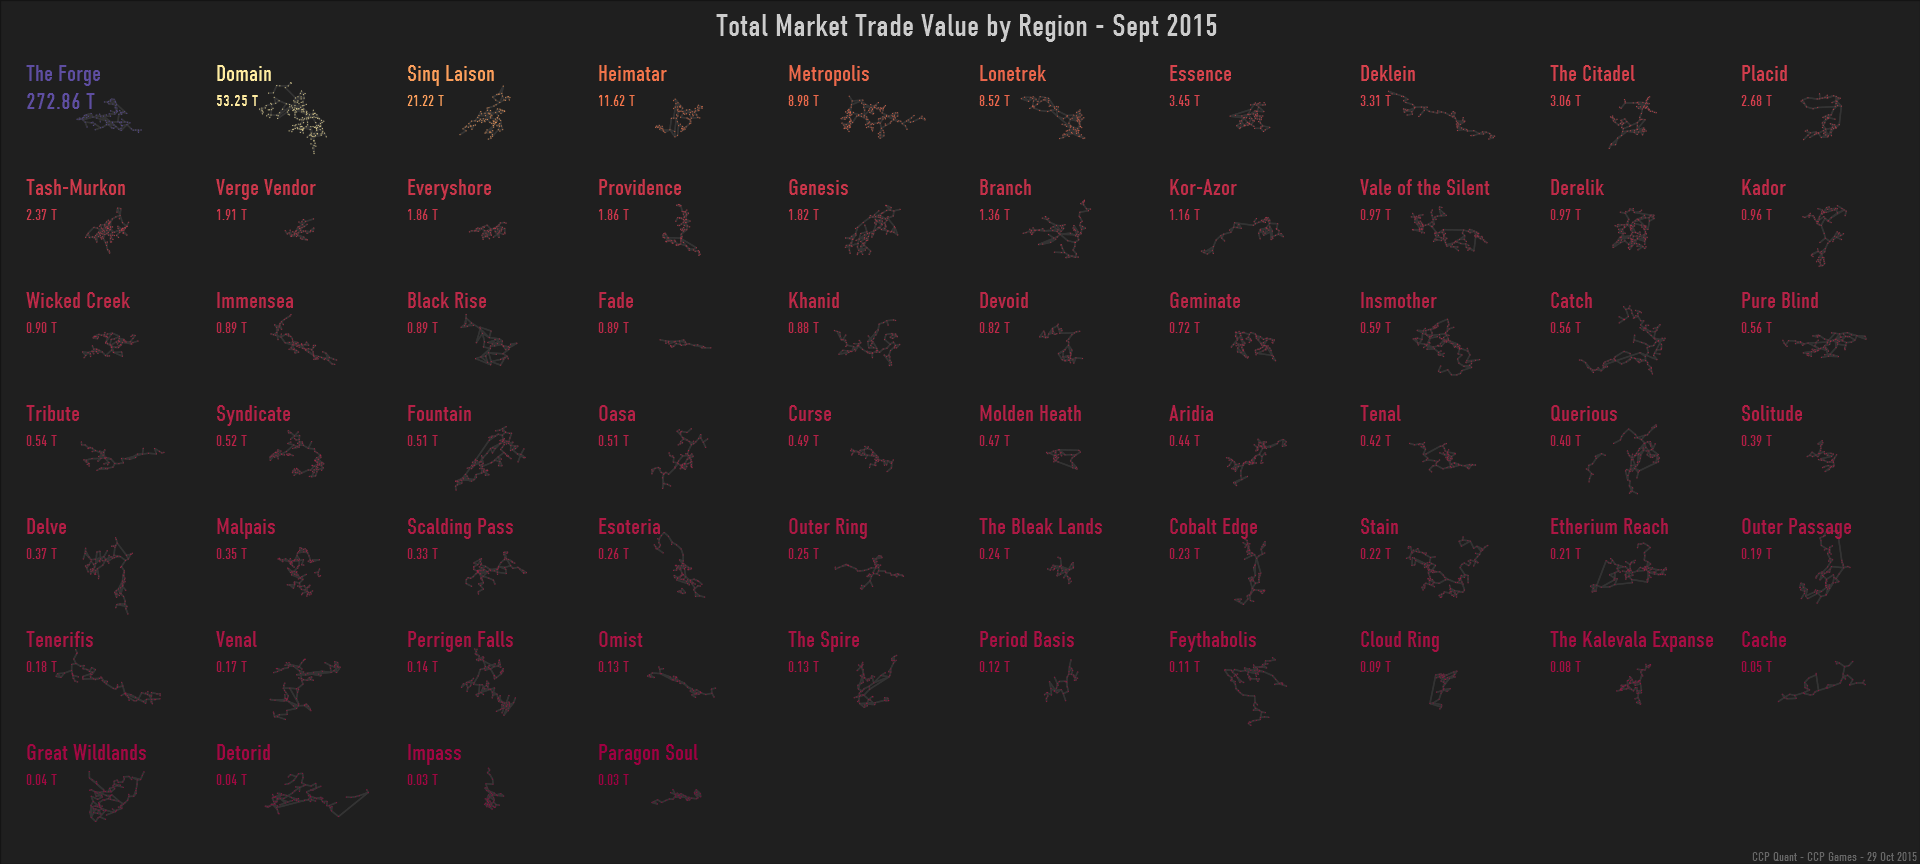
It's also interesting to look at how the major activity metrics like production, destruction, mining, and trading are different by region in September 2015:

.by.region.sept.2015.png)

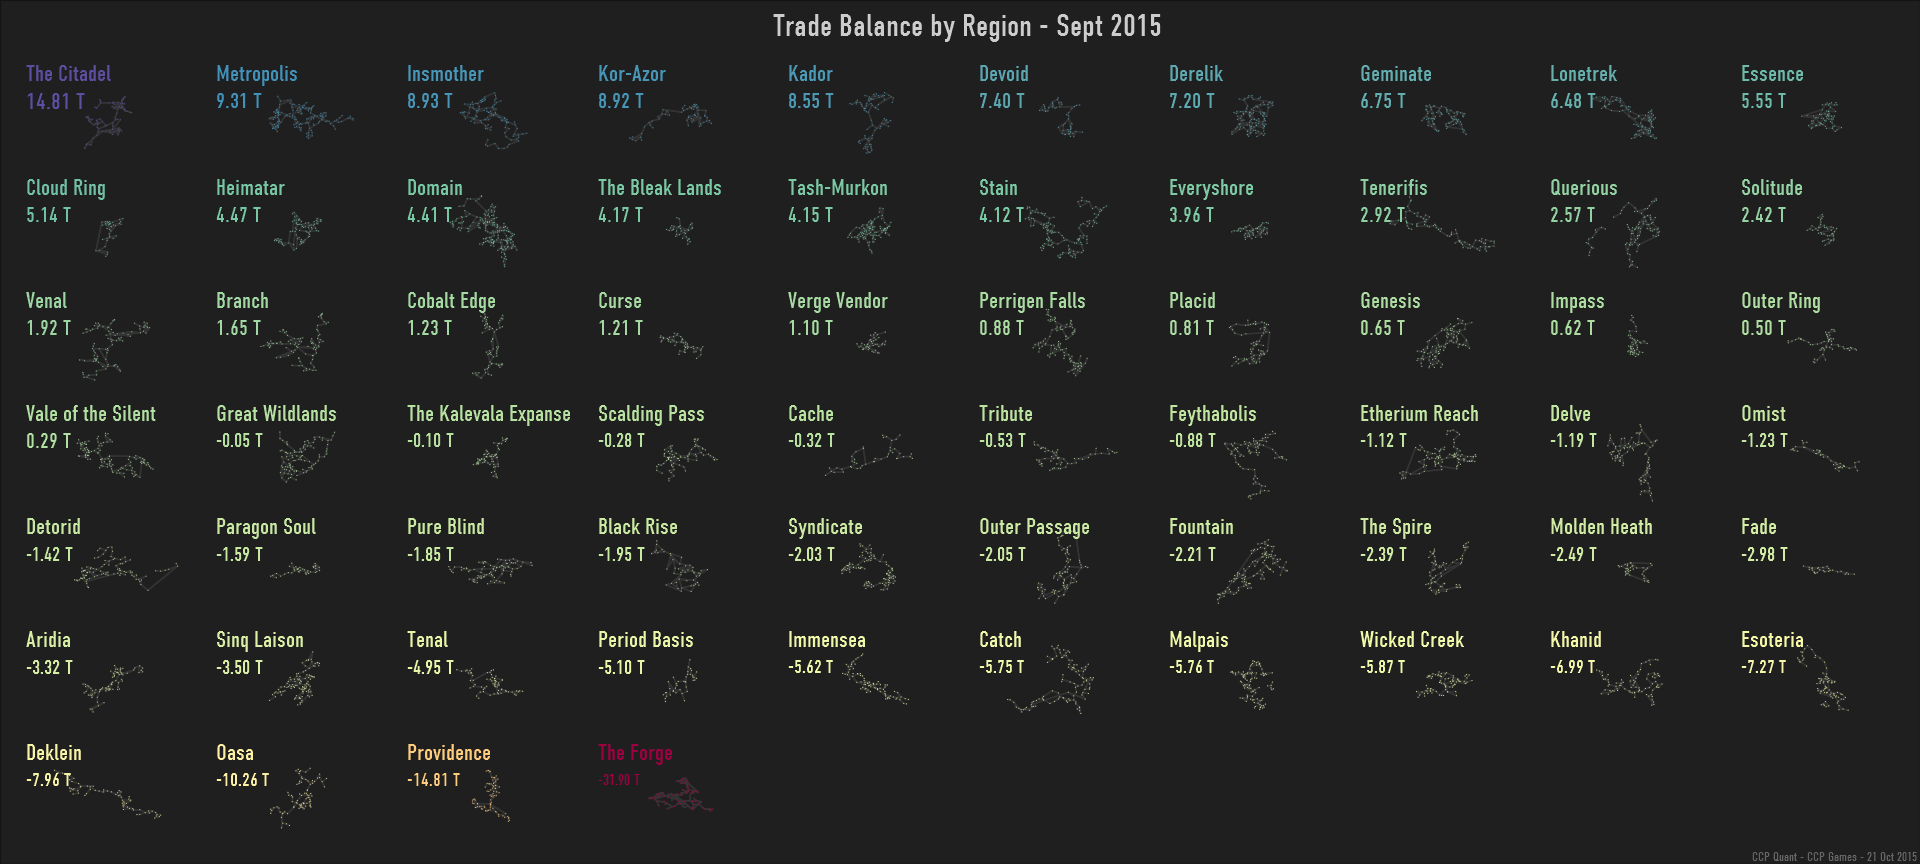
I also include trade balance by regions. This can be done by taking the total value(ships, cargo, fittings) entering and exiting regions through jumps, be it through star gates, wormholes, portals, or jump drives. The net trade balance is then = exports - imports. This is analogous to real life countries' Balance of trade and is generally an interesting metric that shows the depth of the EVE economy and the intricacies of the universe's political- and astrogeographic landscapes.
And by taking the volume of each individual item instead of the market value, we get a feeling for how _much stuff _is being imported into and exported out of regions:
.by.region.sept.2015.png)
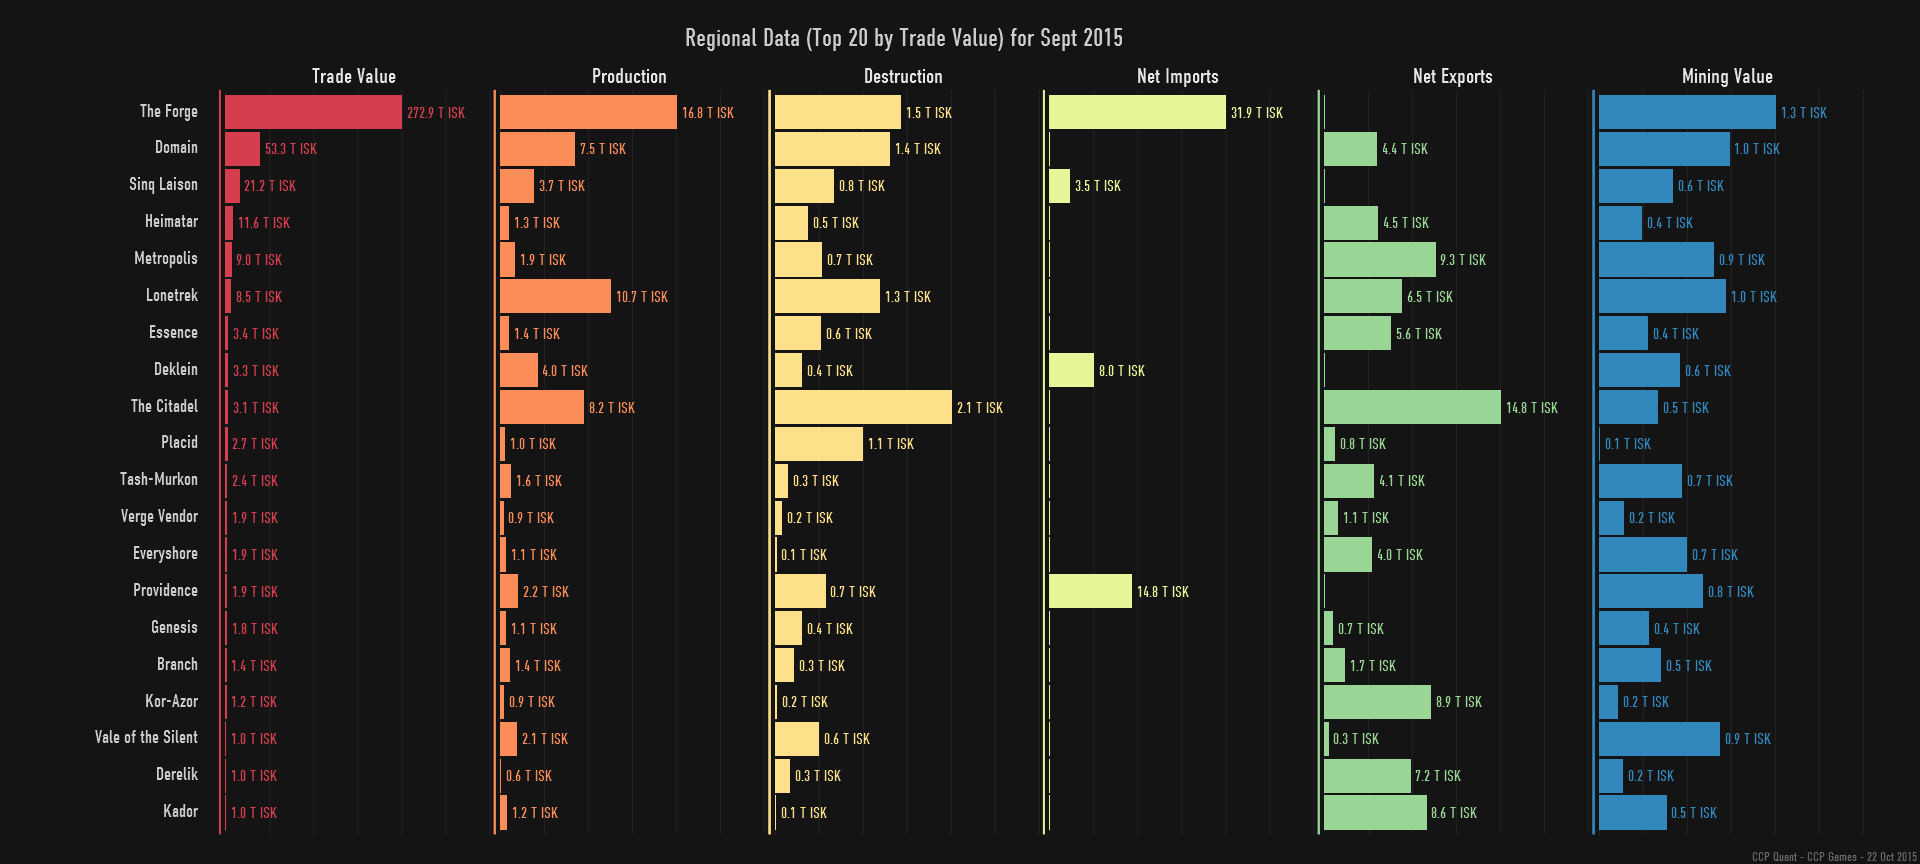
A side by side comparison of the top 20 regions (by trade value) shows a nice summary and the unrelenting dominance of Jita as a central hub:
Presenting this at EVE Vegas, it only felt natural to show how granular we can go on the trade balance data with another good example:
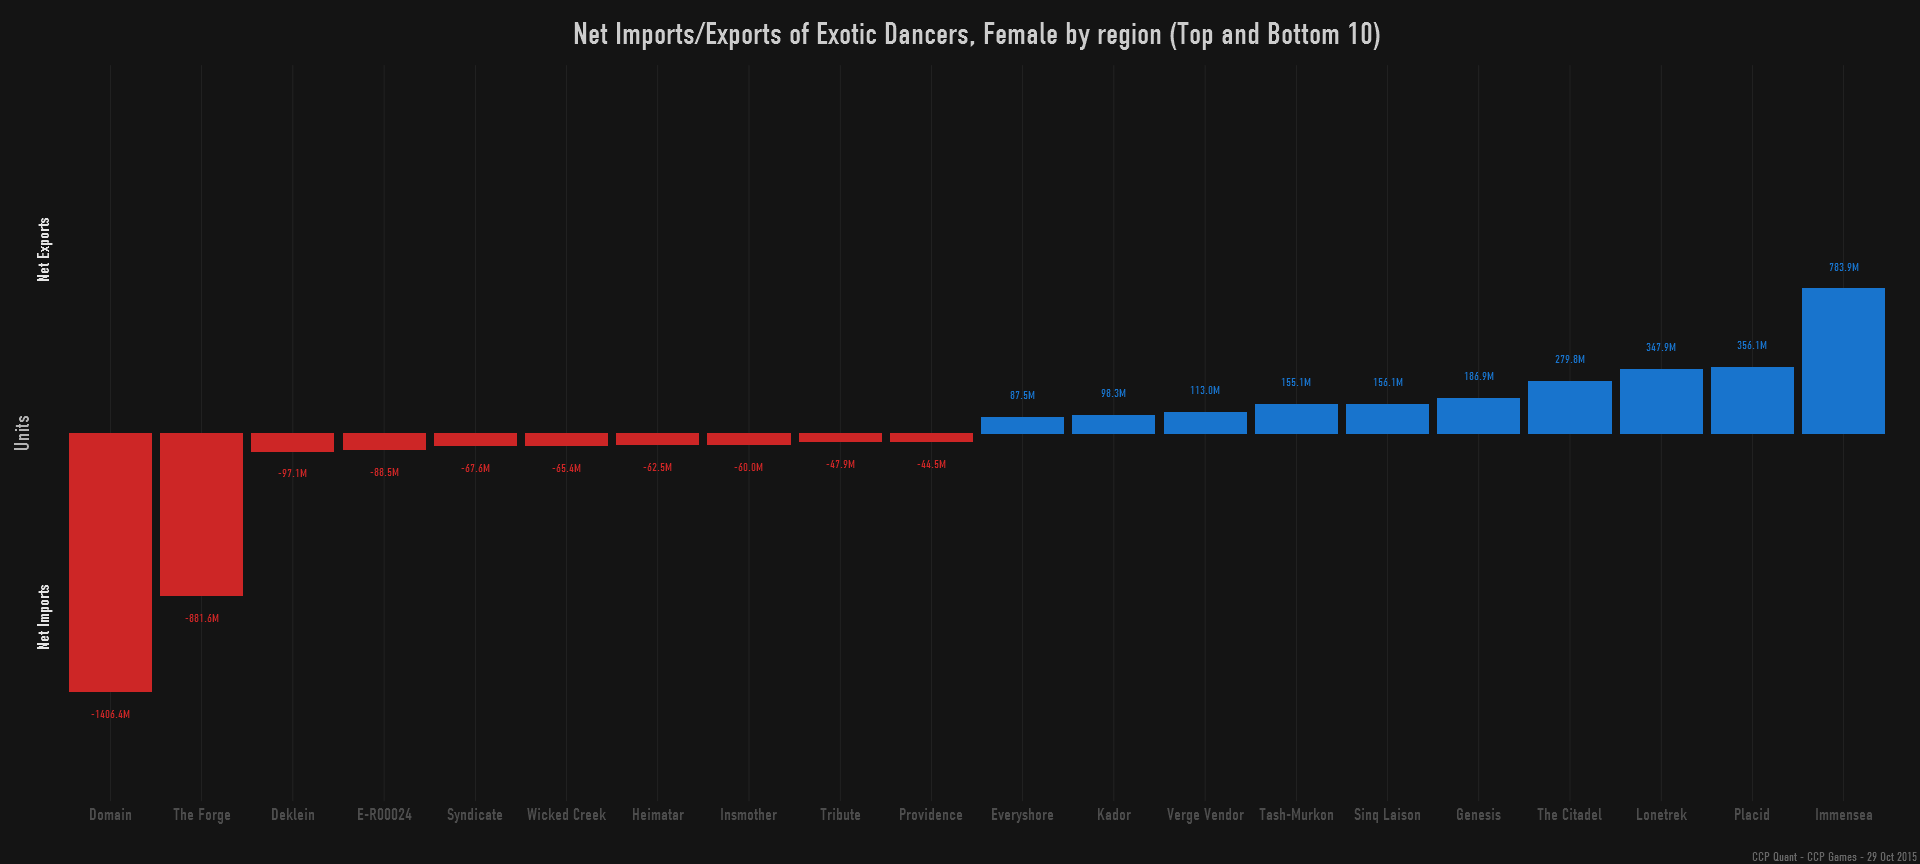
What really stood out there is the fact that the wormhole region E-R00024 is ranked as the 4th largest net importer of female exotic dancers. Those of us who have been in W-Space know how lonely things can get there . Of course we should include male exotic dancers there as well:

We can see how male dancers are really piling up in The Forge (Jita), and again we see wormhole regions being pretty active in the trade of ecdysiasts, with one of them evacuating a lot of "entertainers". These would make for the perfect scrolling headlines in the Scope by the way.
ISK Float, Sinks & Faucets
Sticking to September 2015 as the target month, the following graph shows
- Total ISK on active accounts at the beginning of the month (BOM),
- Total ISK on active accounts at the end of the month (EOM)
- Total ISK that came in through faucets (where ISK is added to the economy by game systems CCP puts in place)
- Total ISK that went out through sinks (where ISK is removed from the economy by game systems CCP puts in place)
- Total ISK that went in / out through player accounts coming and going.
- A complete breakdown of all the different sinks and faucets
And since we are looking at total active ISK in EVE at the start and end of September, we might as well look into how it has been developing over the past years, broken down by Character and Corporation wallets respectively:
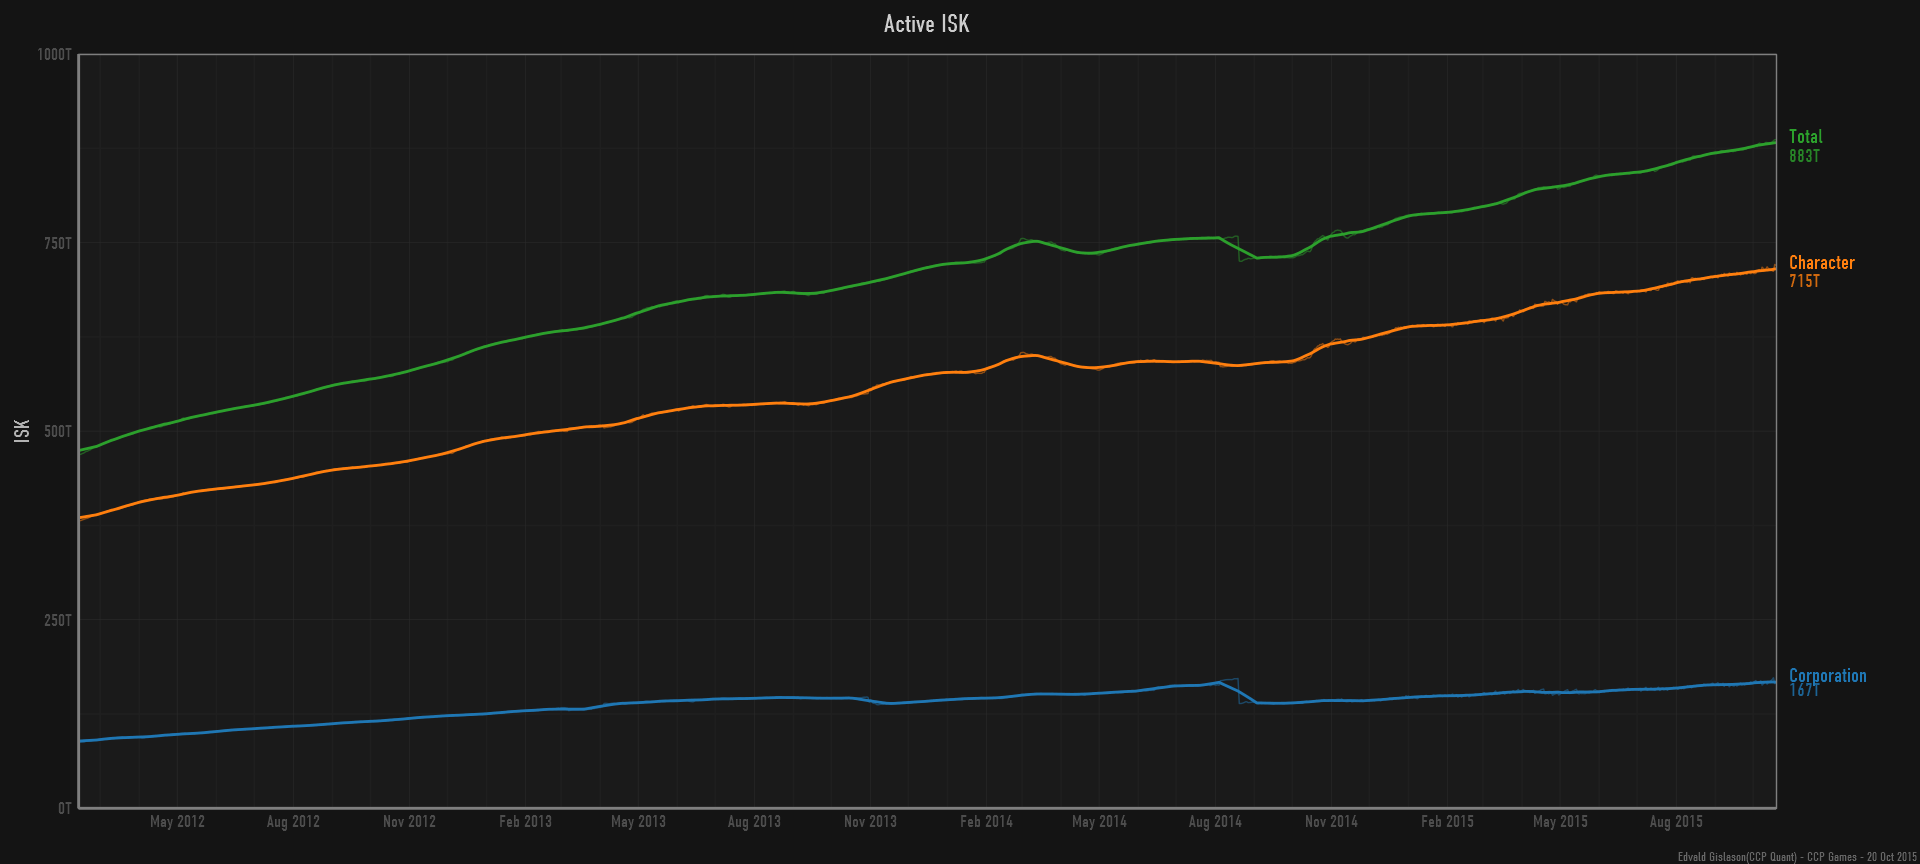
This graph actually ends at the date it was created, which was Oct 20. An interesting thing here is the large drop in corporate wallets back in August 2014. I'll leave it to you guys to figure out the cause of this. As you can see though, the Active ISK float is just increasing and has been doing so pretty consistently since the start of EVE. By taking the total isk market trade value over the total active isk float on every day, we get a metric called _Velocity of ISK (see Velocity of money). _In other words, citing the wikipedia article, it is the estimated number of times one isk is spent to buy goods each month, in this case a 30 day moving sum of total trade over total active isk each day:
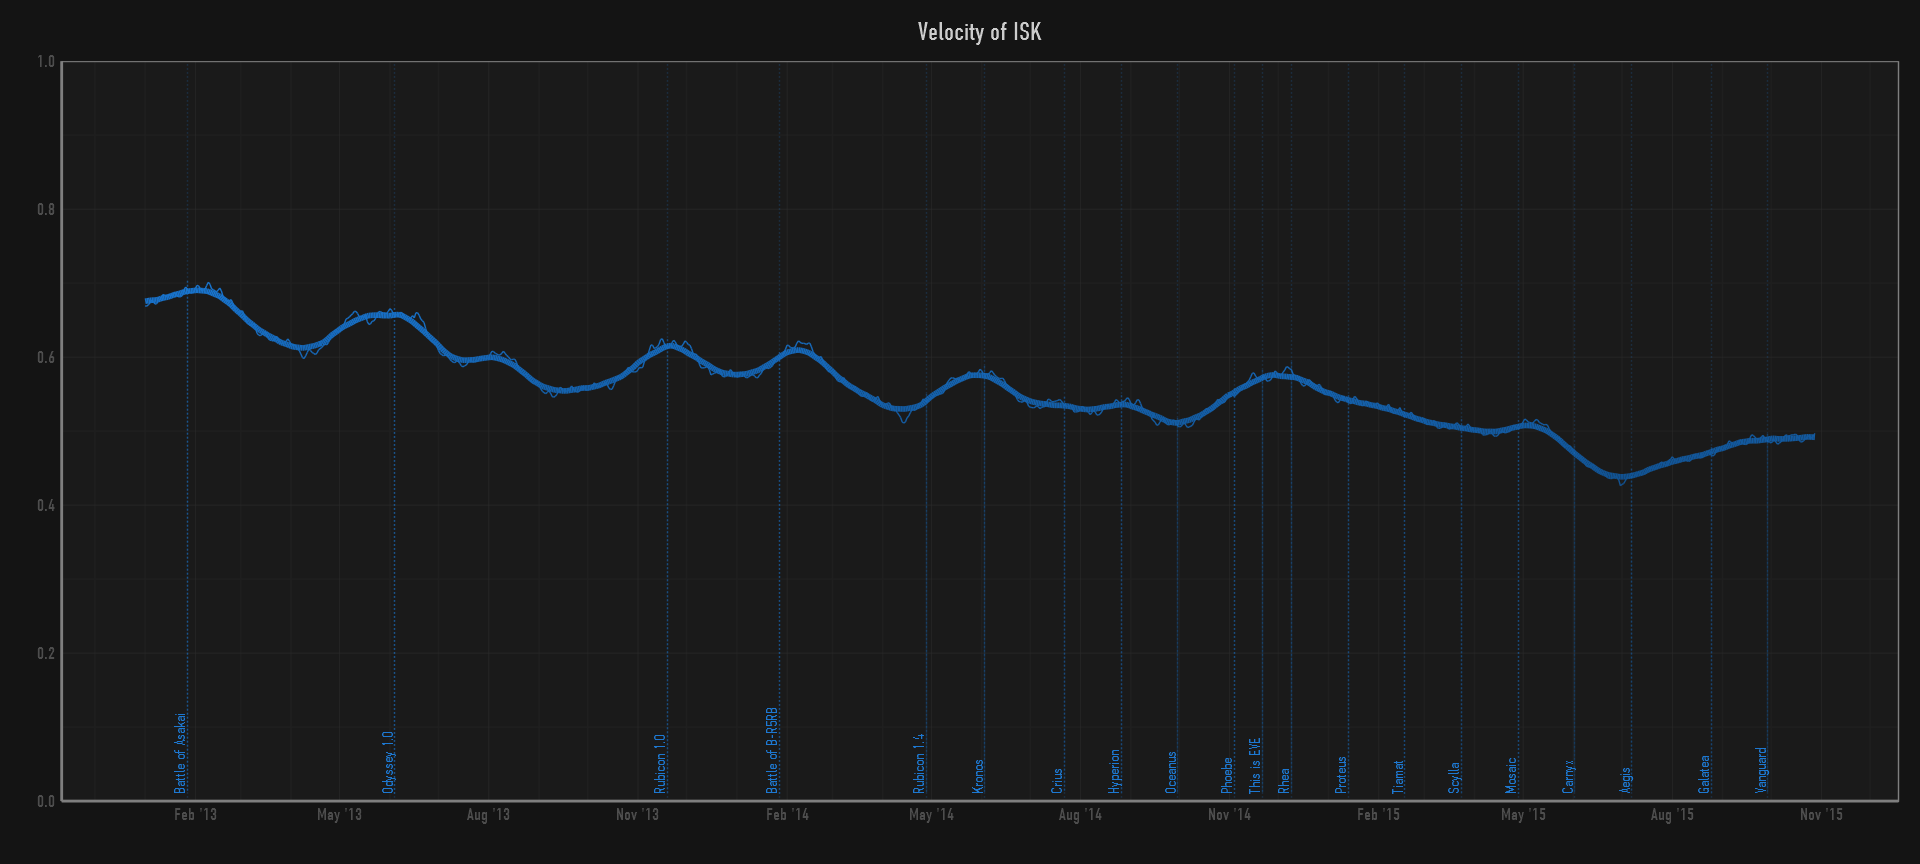
Currently just under 0.5, it has been on a downward trend for the past few years, which indicates that players are sitting on more isk these days that they don't use, and since EVE doesn't have reliable banks that offer interest rates, and no minimum costs of living, players might be inclined to invest in something. This brings us to the price of EVE's equivalent of the gold standard, PLEX:
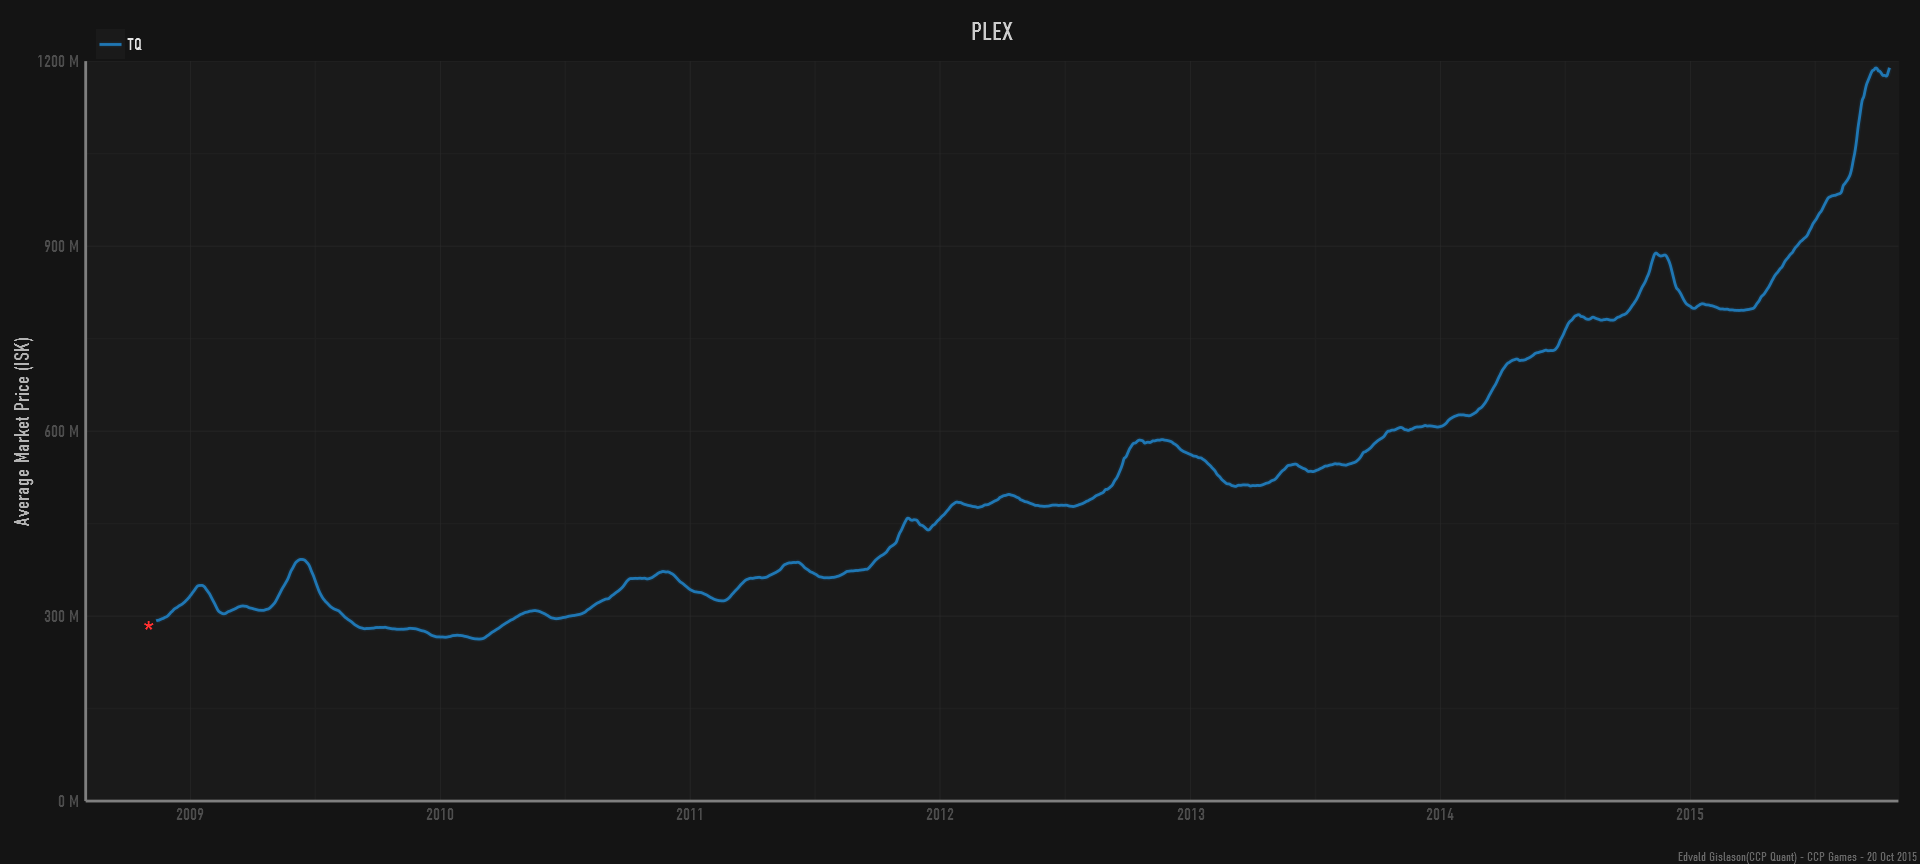
While I'm not going to go any deeper into analysing the price of PLEX and where it's heading, the information provided here should make for some interesting discussion in the market trader community. Just out of curiosity I looked into how PLEX prices have been on the Serenity server (Tranquility's counterpart in China):
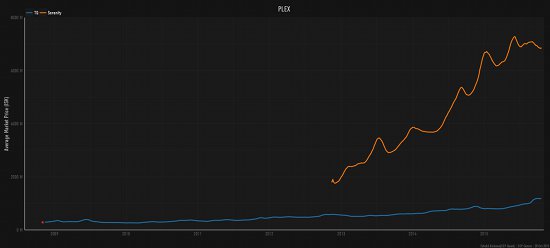
They're currently trading at around 6.8B each over there. This is quite a lot considering that a PLEX costs on average about $9 compared to about $17 on TQ. Another interesting fact is that gold pods(Capsule - Genolution 'Auroral' 197-variant) are selling there for 50B ISK right now. However, these are two completely different economies and comparing them would make for a complete sepearate devblog!
Economic Price Indices
What about inflation in New Eden?
Time to look deeply into the economic price indices of EVE. Back in the days Dr. Eyjó and CCP Recurve maintained an excel file of the price indices with a lot of manual work, which made it time consuming to maintain and regularly release them. I recently rewrote some of their work in SQL/R, which now takes about 20 minutes to recompute the entire history of the 4 price indices. This makes it much easier for us to publish them automatically and more frequently. The price indices are Chained Laspeyres Indices and while I comically failed to try to explain them in simple terms during my EVE Vegas 2015 presentation, here goes for another try: You have a basket of items, for CPI those would be end-products that characters buy: ships, modules, implants, skills, ammunition, structures, rigs, drones, boosters, fuel, etc. You take what this basket of items (including total units sold by item) from previous month, and find the ratio of how much it would cost this month over how much it actually cost last month. The base period is set to 100 and then changes each month are applied from there on. The difference between a chained and non-chained calculations is that in non-chained your item basket is set by the base period. So we're looking at price index development since January 2004, we would still use that same basket today. This is problematic since we constantly add and change products (types) to EVE through releases. The market basket of consumer goods today is vastly different since 2003 since we've e.g. added Tech II, III.
So here we go, price indices of New Eden since 2003:

Naturally, everyone looking at this graph will wonder about the spikes here and there, the permanent downward or upward spikes or slopes, etc. Being able to answer for all of them, one would have to know every single detail to every patch we've ever done on EVE. Not being one of those who do, I wanted to make graphs that could help decomposing both the basket component weights of each index and the every monthly change, i.e. which part of each basket contributed to the largest changes over time. I also included some vertical line markers for notable spikes/events and marked in the expansion closest to them. I'll only do a brief summary on some interesting changes and observations, letting you guys do the deep diving into the specifics.
CPI
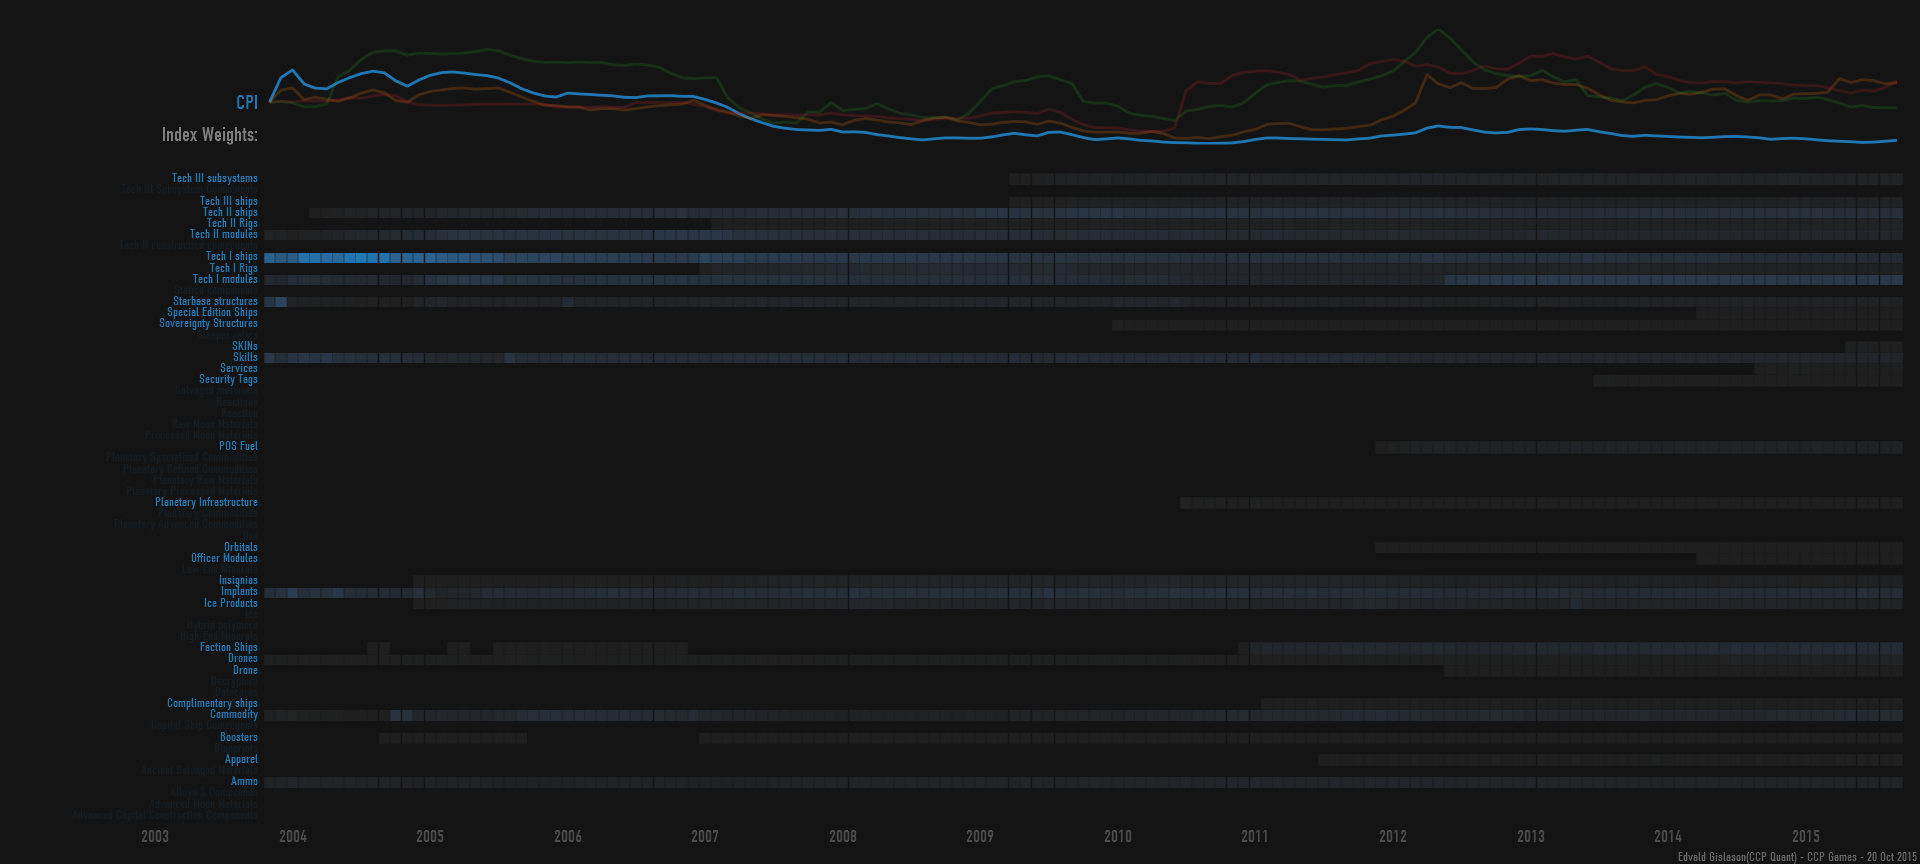
On this graph you can see that Tech I ships were by far the largest part of the CPI basket back in 2003-2005. Since then we've added rigs, a lot more T1 modules, T2, T3, etc, making the CPI more blended across groups.
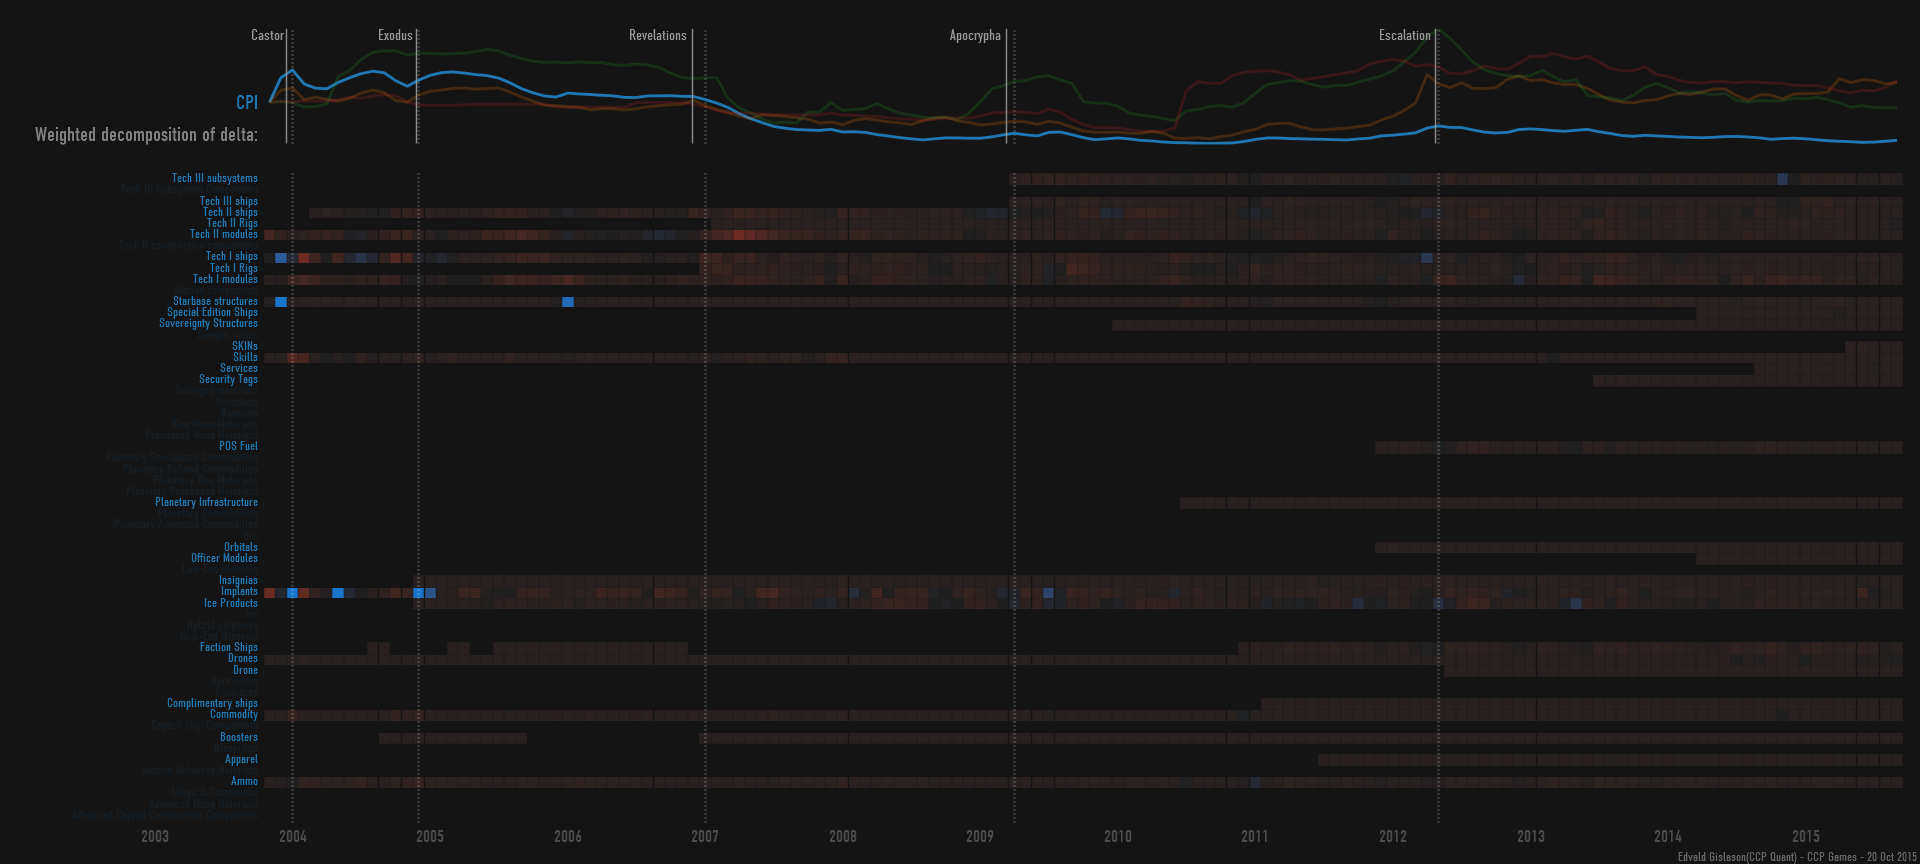
This graph shows what groups of items contributed most to a change in the index at any given month. This clearly shows that a lot of the downward trend after Revelations is because of lowering prices of T2. Can you spot why?
Mineral Price Index
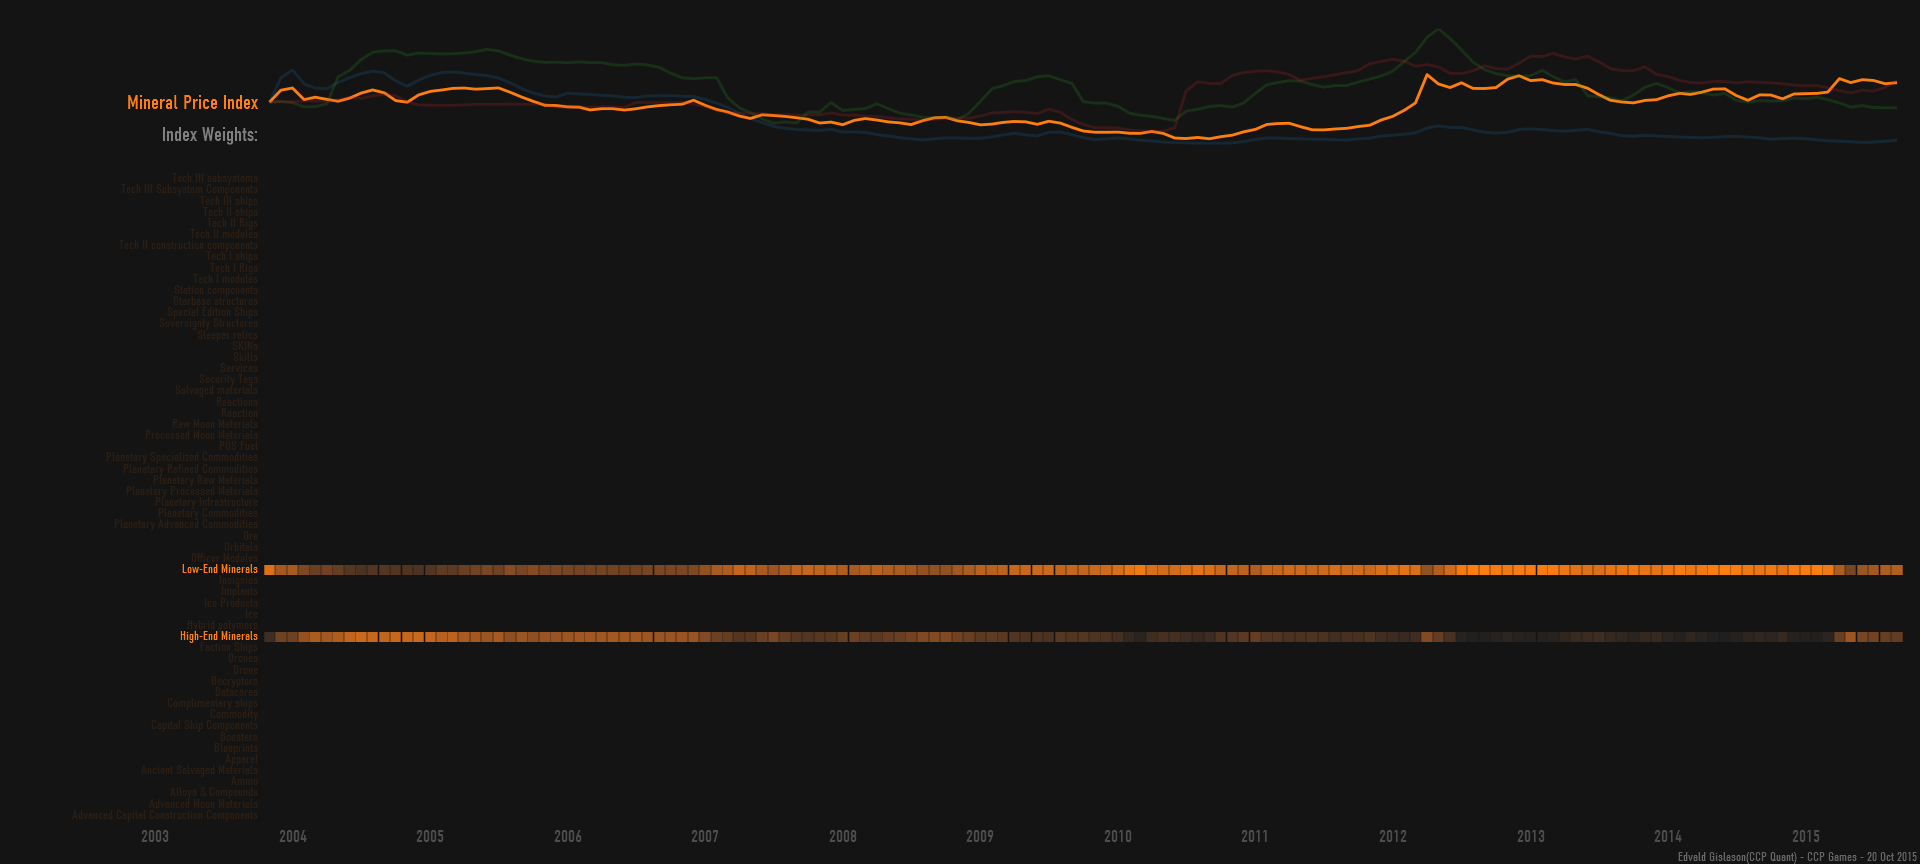
The main part of the mineral price index was high-end minerals (Megacyte, Zydrine, Nocxium, and Morphite) back in 2004-2007, low-end minerals dominated between 2007 and mid-2015 when we doubled the amount of Zydrine and Megacyte in almost every product, making these two mineral groups weigh closer to equal in the Mineral Price Index.
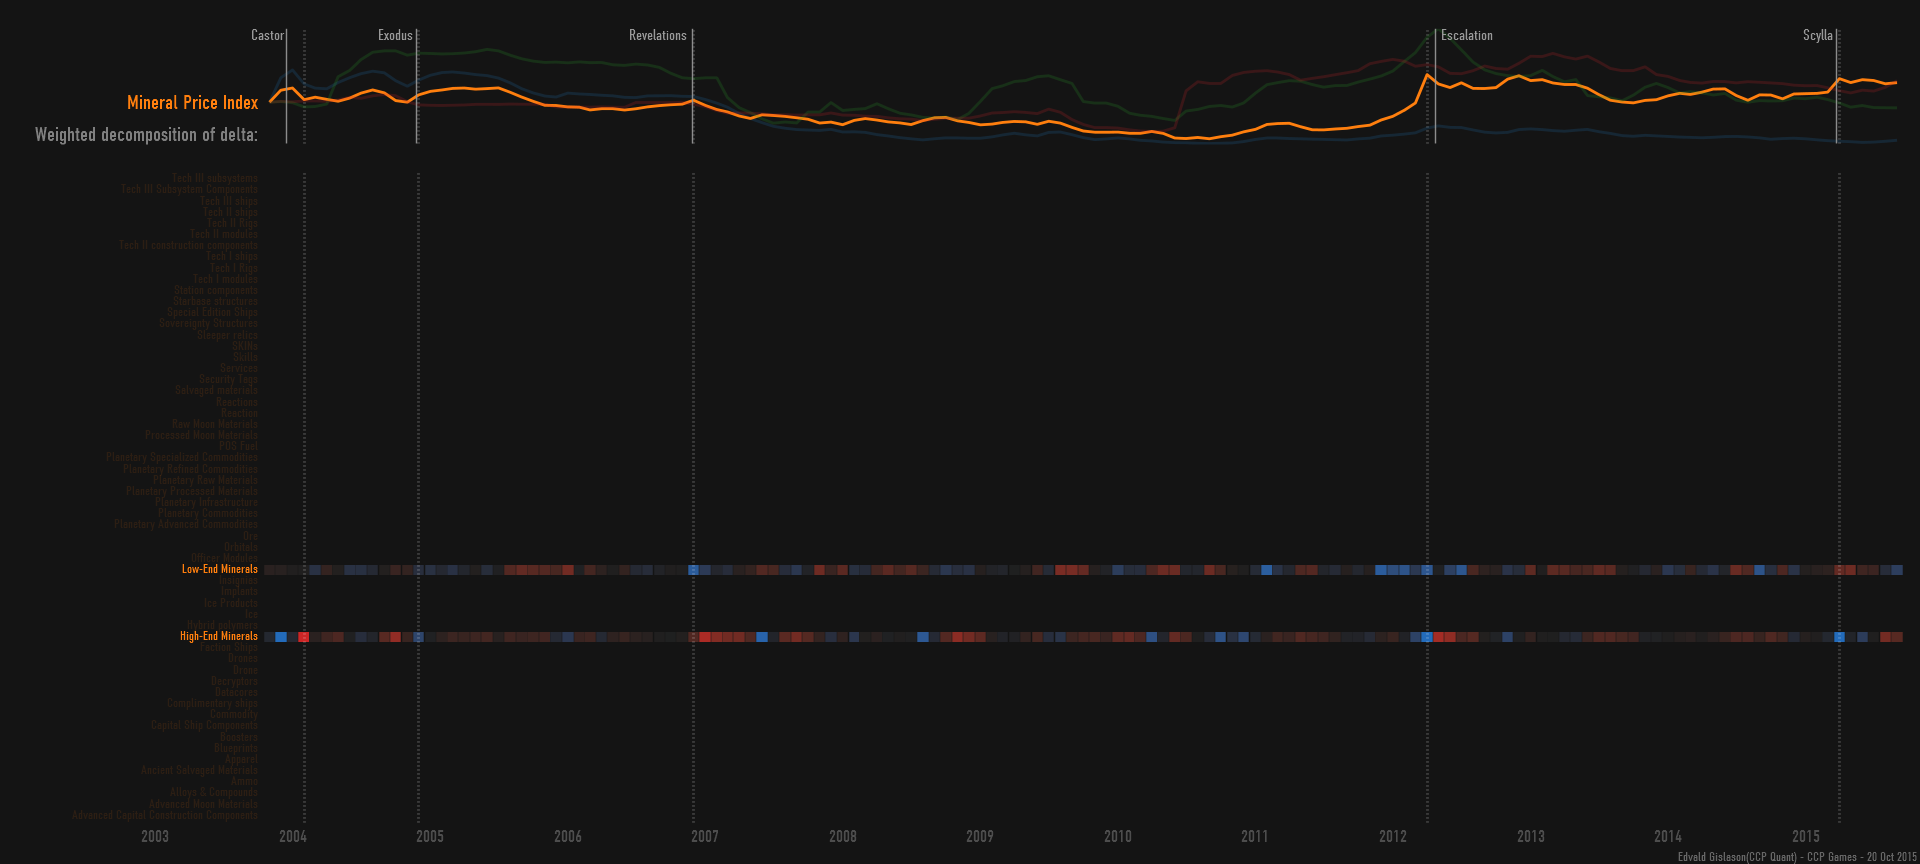
This change can clearly be seen here shortly after the Scylla release. Low-end minerals increased in price steadily leading up to Escalation (to Inferno) and high-end minerals spiking temporarily.
Primary Producer Index
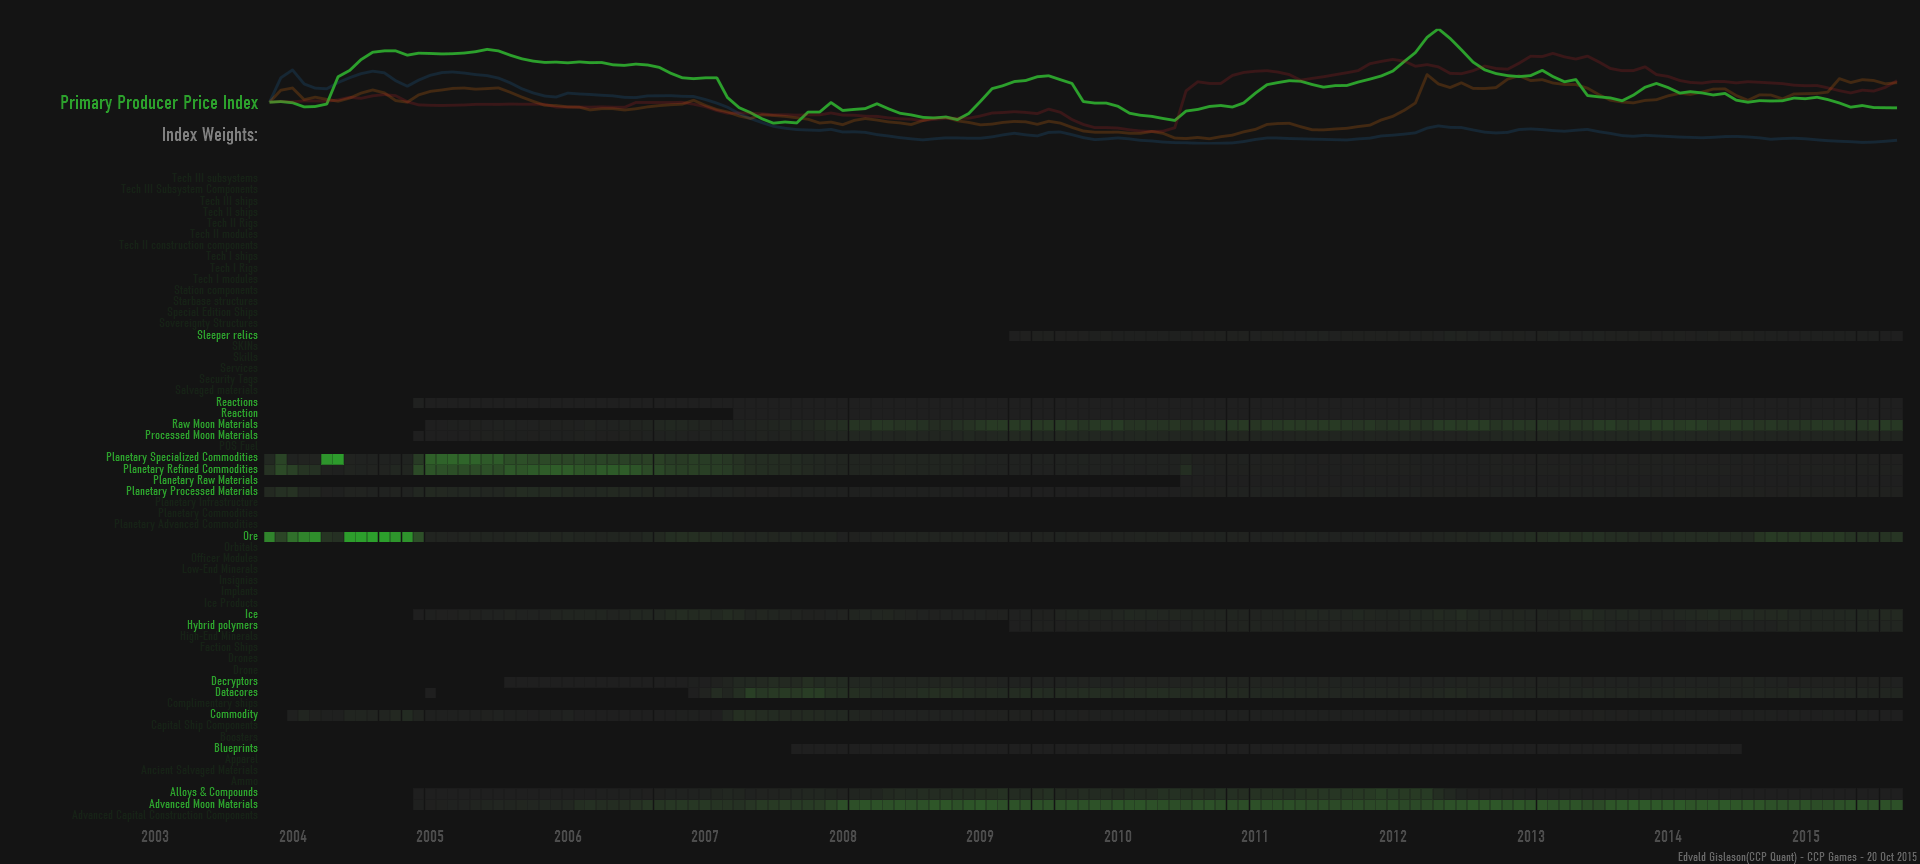
Ore was the primary component of the primary producer index pre 2005, and soon after planetary commodities took over as the primary component for 2 years. This graph is using current naming, which explains why you're seeing planetary commodities prior to Tyrannis. For the past 8 years or so, the primary components of the index have been Raw and Advanced Moon Materials.
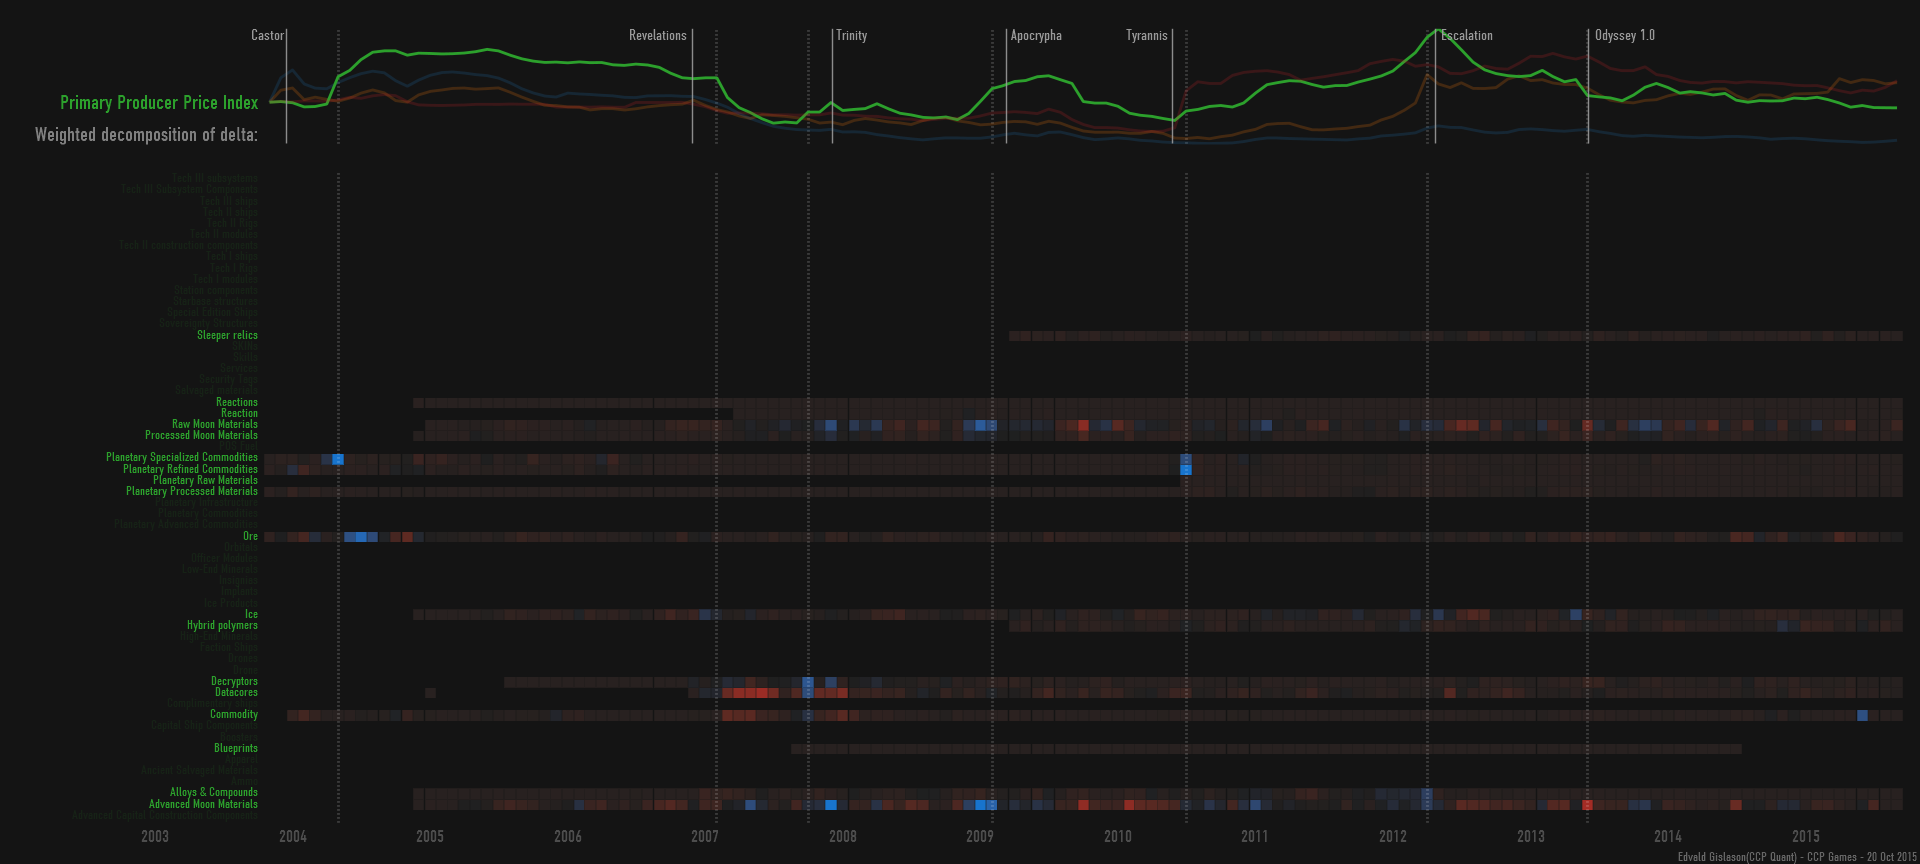
On the delta graph we can see how a rapid drop in the prices of datacores were the main reason for the decline in this index back in 2007. Most of the overall volatility seems to be coming from Moon Materials.
Secondary Producer Index
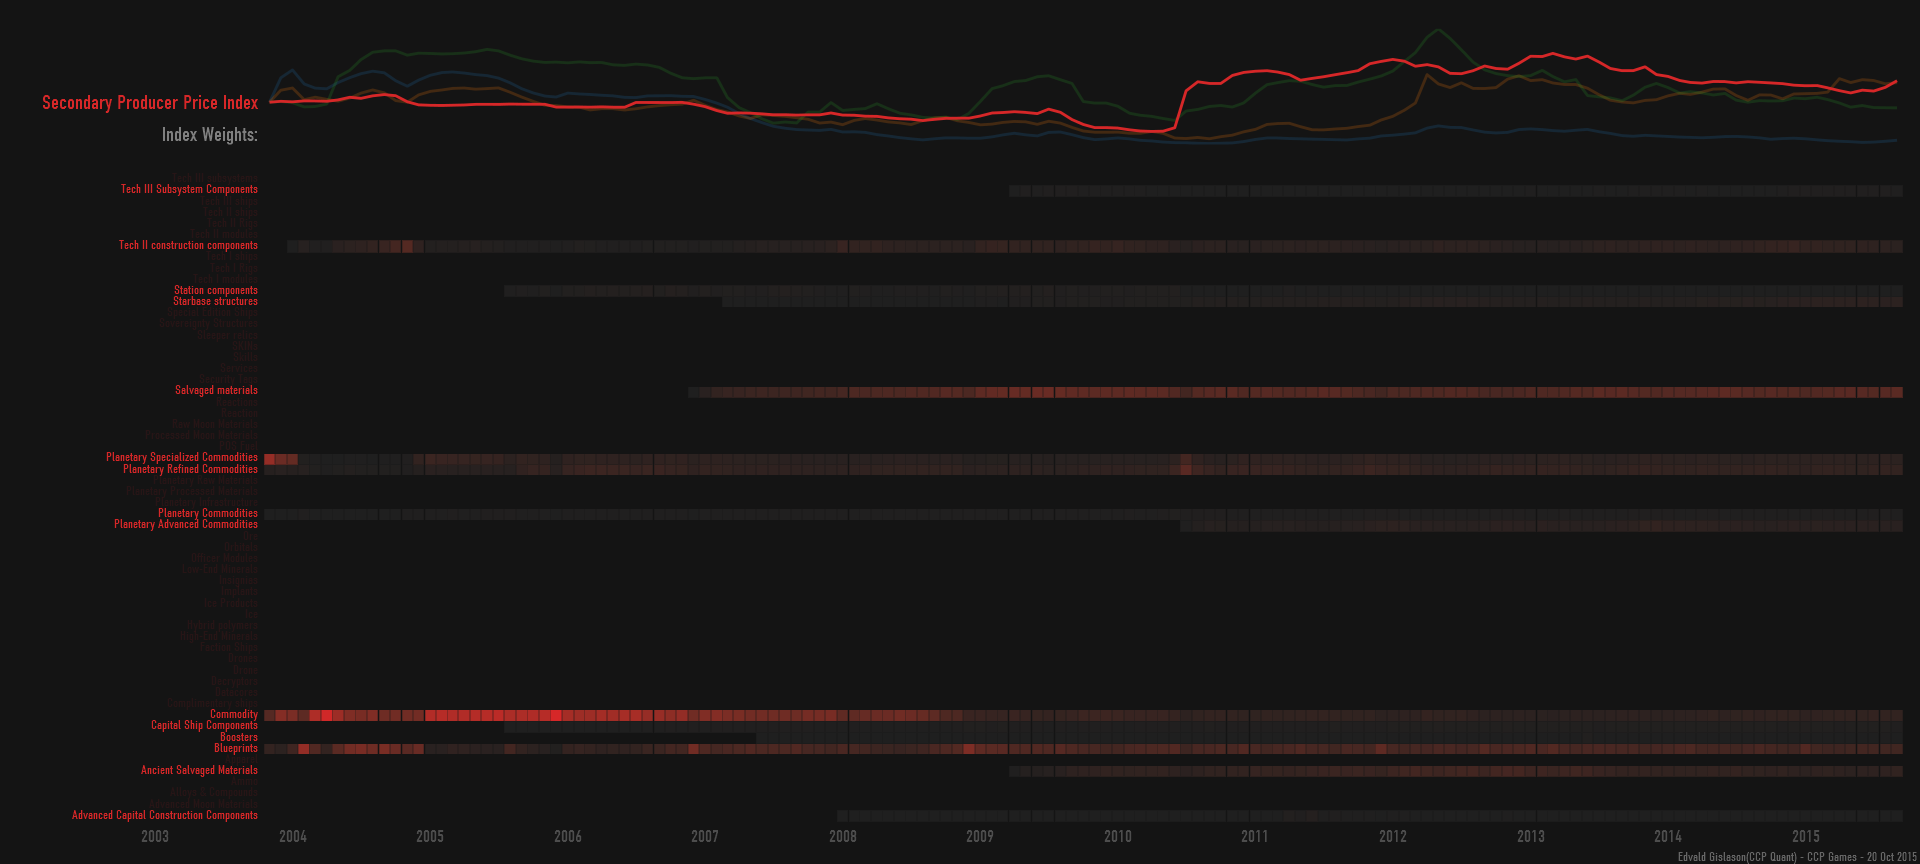
The primary producer index currently has salvage, blueprints, and planetary commodities as the main components.
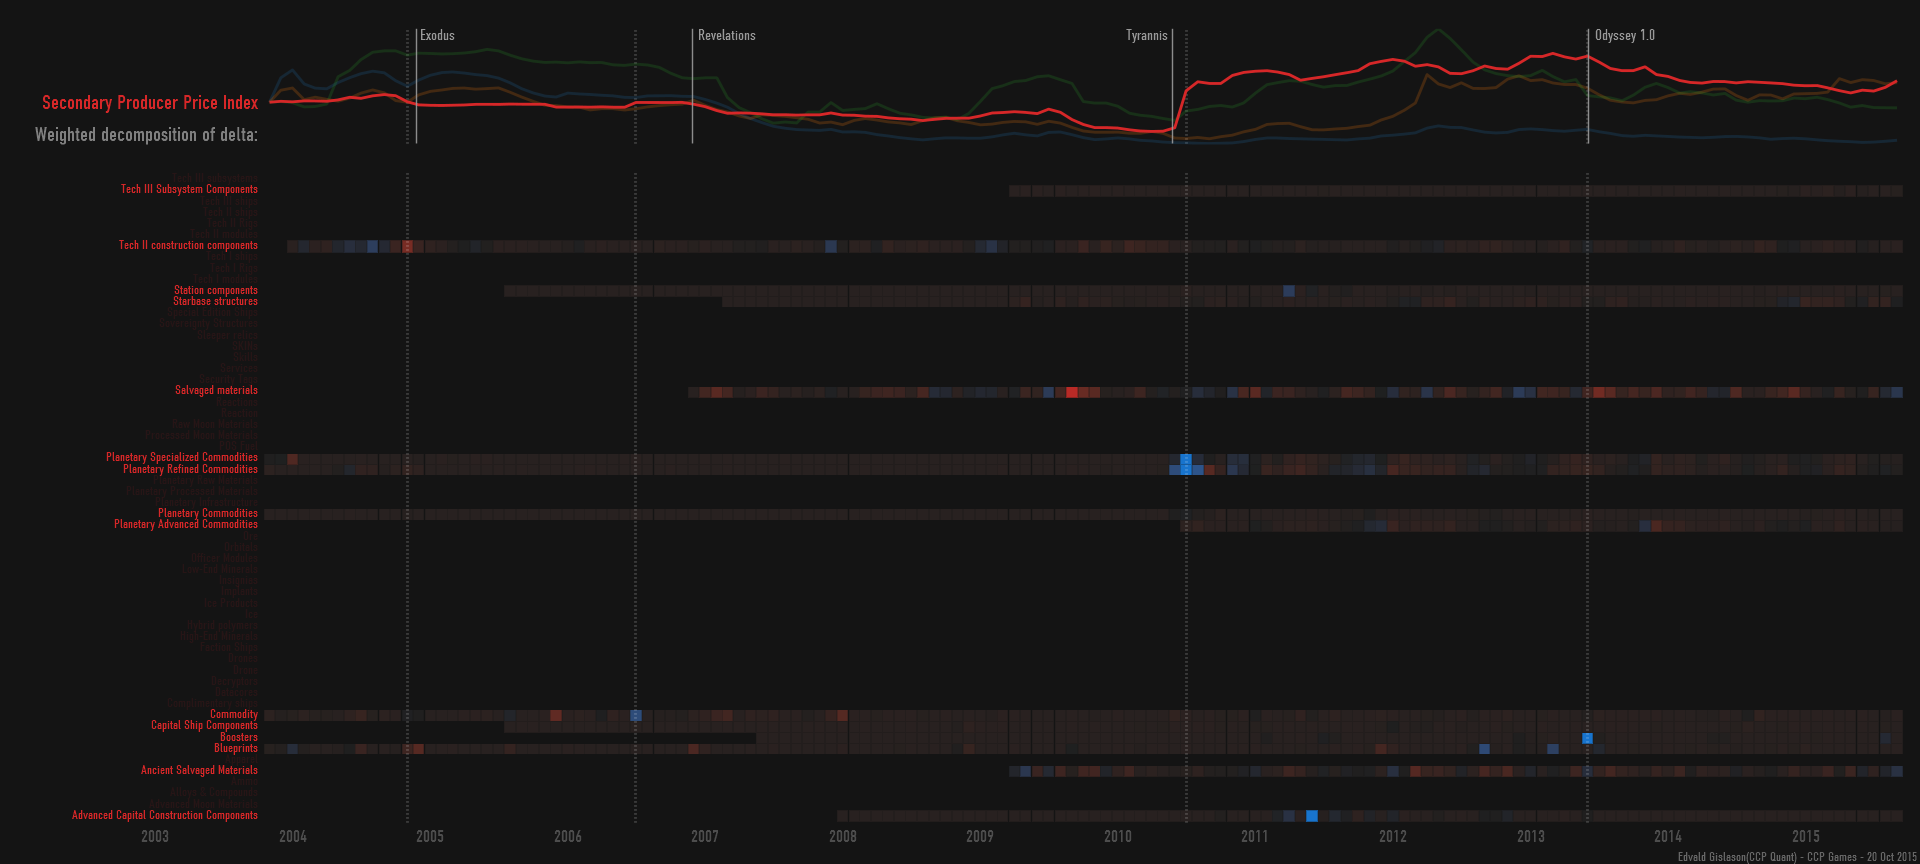
The spike in the price of planetary commodities caused a permanent rise in the index when we released Planetary Interaction back in Tyrannis.
Conclusion
Many of these graphs will become a part of our Monthly Economic Report (announced on the o7 show), which will in a way be filling the information gap that was created when the Quarterly Economic Newsletters(QENs) were discontinued. We might later move these releases into the EVE client itself, so the Secure Commerce Commission would be taking over. We'll also be looking at ways to distributing some datasets behind these graphs.
The economic devotee in me hopes that, in the not so distant future, all items in EVE Online will be player made and tradeable, including blueprints, skills, and skillpoints. There is a lot to be considered, discussed, and adjusted before then, but that’s my hope.
CCP Quant out!