The Economy “Burns“ (Price Indices – May 2012)
When some people notice a fire, their instinctive reaction is to reach for a bucket of fuel. Many of those people play EVE.
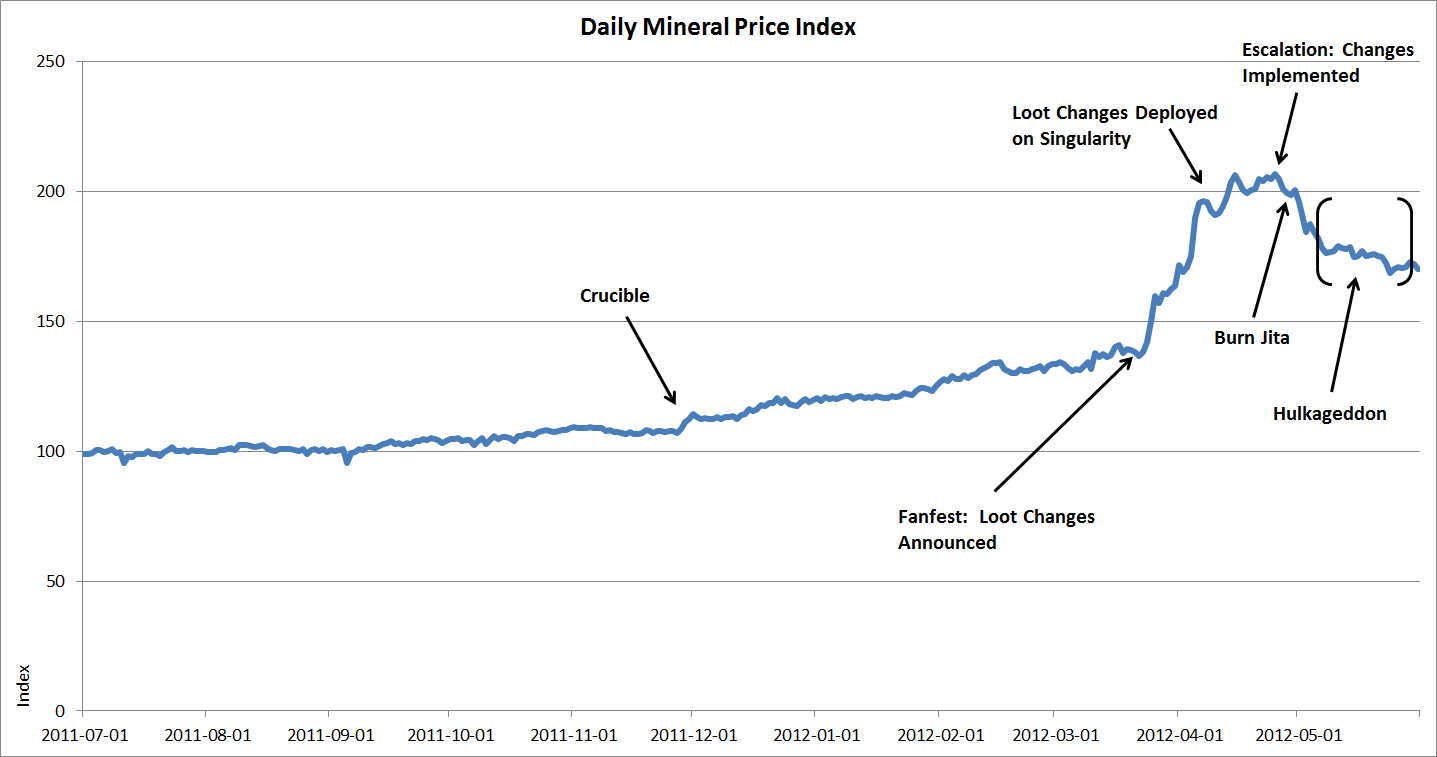
The heavy inflation that has characterized the economy since December is starting to subside, with the Mineral Price Index falling by 7.9% in May. Inflation reached its peak between March and April, where the biggest change in prices was in the MPI, which jumped by an incredible 32%. Prior to this, the biggest change ever recorded in the MPI was a 13% rise in December 2003. The only time one of the main indices had jumped higher in one month was in July 2010, when the SPPI rose by 38% following the Tyrannis expansion, which introduced Planetary Interaction. The accumulated rise in the MPI from November 2011 to April was 75%.
The release of Crucible, on November 29, started the ascent of the mineral prices in earnest, with heightened activity and increased demand. Then came the decision to make some drastic changes to loot drops, which were an important source of minerals. This was announced at Fanfest, which sent prices soaring. When the changes were deployed to Singularity, players got the chance to better quantify the impact of the changes. Prices only rose slightly more as a result of this, but then mostly stayed stable until implementation on Tranquility in Escalation, on April 24.
From the announcement at Fanfest to implementation in Escalation, speculating traders stockpiled large quantites of minerals, for resale after launch. The following figure shows the daily development of the MPI from July 2011.
Click to enlarge
A very large group of entrepreneurs gathered an immense fleet in Jita for Burn Jita, an event so big that it made the news. This targeting of the main trade hub of Jita caused massive destruction. The following graph shows the destroyed mass of ships in Jita on the weekend of Burn Jita and the weekend prior to it. Tonnage destroyed during Burn Jita was 23 times that of the previous weekend. A total of 15,766 ships were destroyed, having a total mass of 123 Megatonnes, and that‘s not counting the cargo or the fittings.

Even more importantly, Burn Jita marked the beginning of Hulkageddon, an event aimed at destroying mining vessels and lasting a full month. Hulkageddon suppresses the supply of minerals, which forces prices upwards. The following graph shows how total volume mined dropped during Hulkageddon. It mixes all ore types together and is used here to show mining activity, rather than value.

Click to enlarge
As can be seen from the first graph, mineral prices actually started falling sharply after the release of Escalation and fell even more sharply following the burning of Jita. This is where the bubble of speculation and manipulation burst, as owners of mineral stocks cashed in. However, Hulkageddon has unquestionably served to slow the fall, so mineral prices can be expected to fall further following the end of the event.
The index values for May are:
|
May 2012 |
1 Month Change |
12 Month Change | |
|
Mineral Price Index |
125.0 |
-7.9% |
65.1% |
|
Primary Producer Price Index |
118.9 |
5.5% |
47.2% |
|
Secondary Producer Price Index |
110.3 |
-1.7% |
4.5% |
|
Consumer Price Index |
83.8 |
1.6% |
26.1% |
Consumer prices rose by 1.6%, primarily driven by ice products, which are also affected by Hulkageddon. The Primary Producer Price Index climbed by 5.5%, in which ice and moon materials were the dominant contributors. On the other hand, the Secondary Producer Price Index fell by 1.7%, with deflation in most notable categories, except Tech II construction components.

Click to enlarge
It was obvious from the start, that the fundamentral changes being made to loot would upset the mineral market in a major way, which would affect other markets as well. However, as one source of minerals fades, rising prices boost other sources and the market finds a new equilibrium. In the long-term, the economy is probably in reasonably good health, although it does seem to have bad case of the flu at the moment. It should prove interesting to watch it recover over the next 2 to 3 months.
For more detail on the indices, please refer to the Market Indices page on Evelopedia.