Behind the Scenes of a long EVE Online downtime
This dev blog was written collaboratively with CCP Masterplan.
This dev blog is an account of what happened behind the scenes when EVE Online had one of its longest downtimes in years, on July 15th 2015. We are sharing it with you because we know a lot of players work in the IT field and might appreciate the war stories, and because it gives some interesting insight on the inner workings of a rather unique game cluster. If these things interest you, read on for an account of what happened on July 15th. If you are happy to be oblivious to these details, we recommend the more high level summary we posted here shortly after the incident.
Background
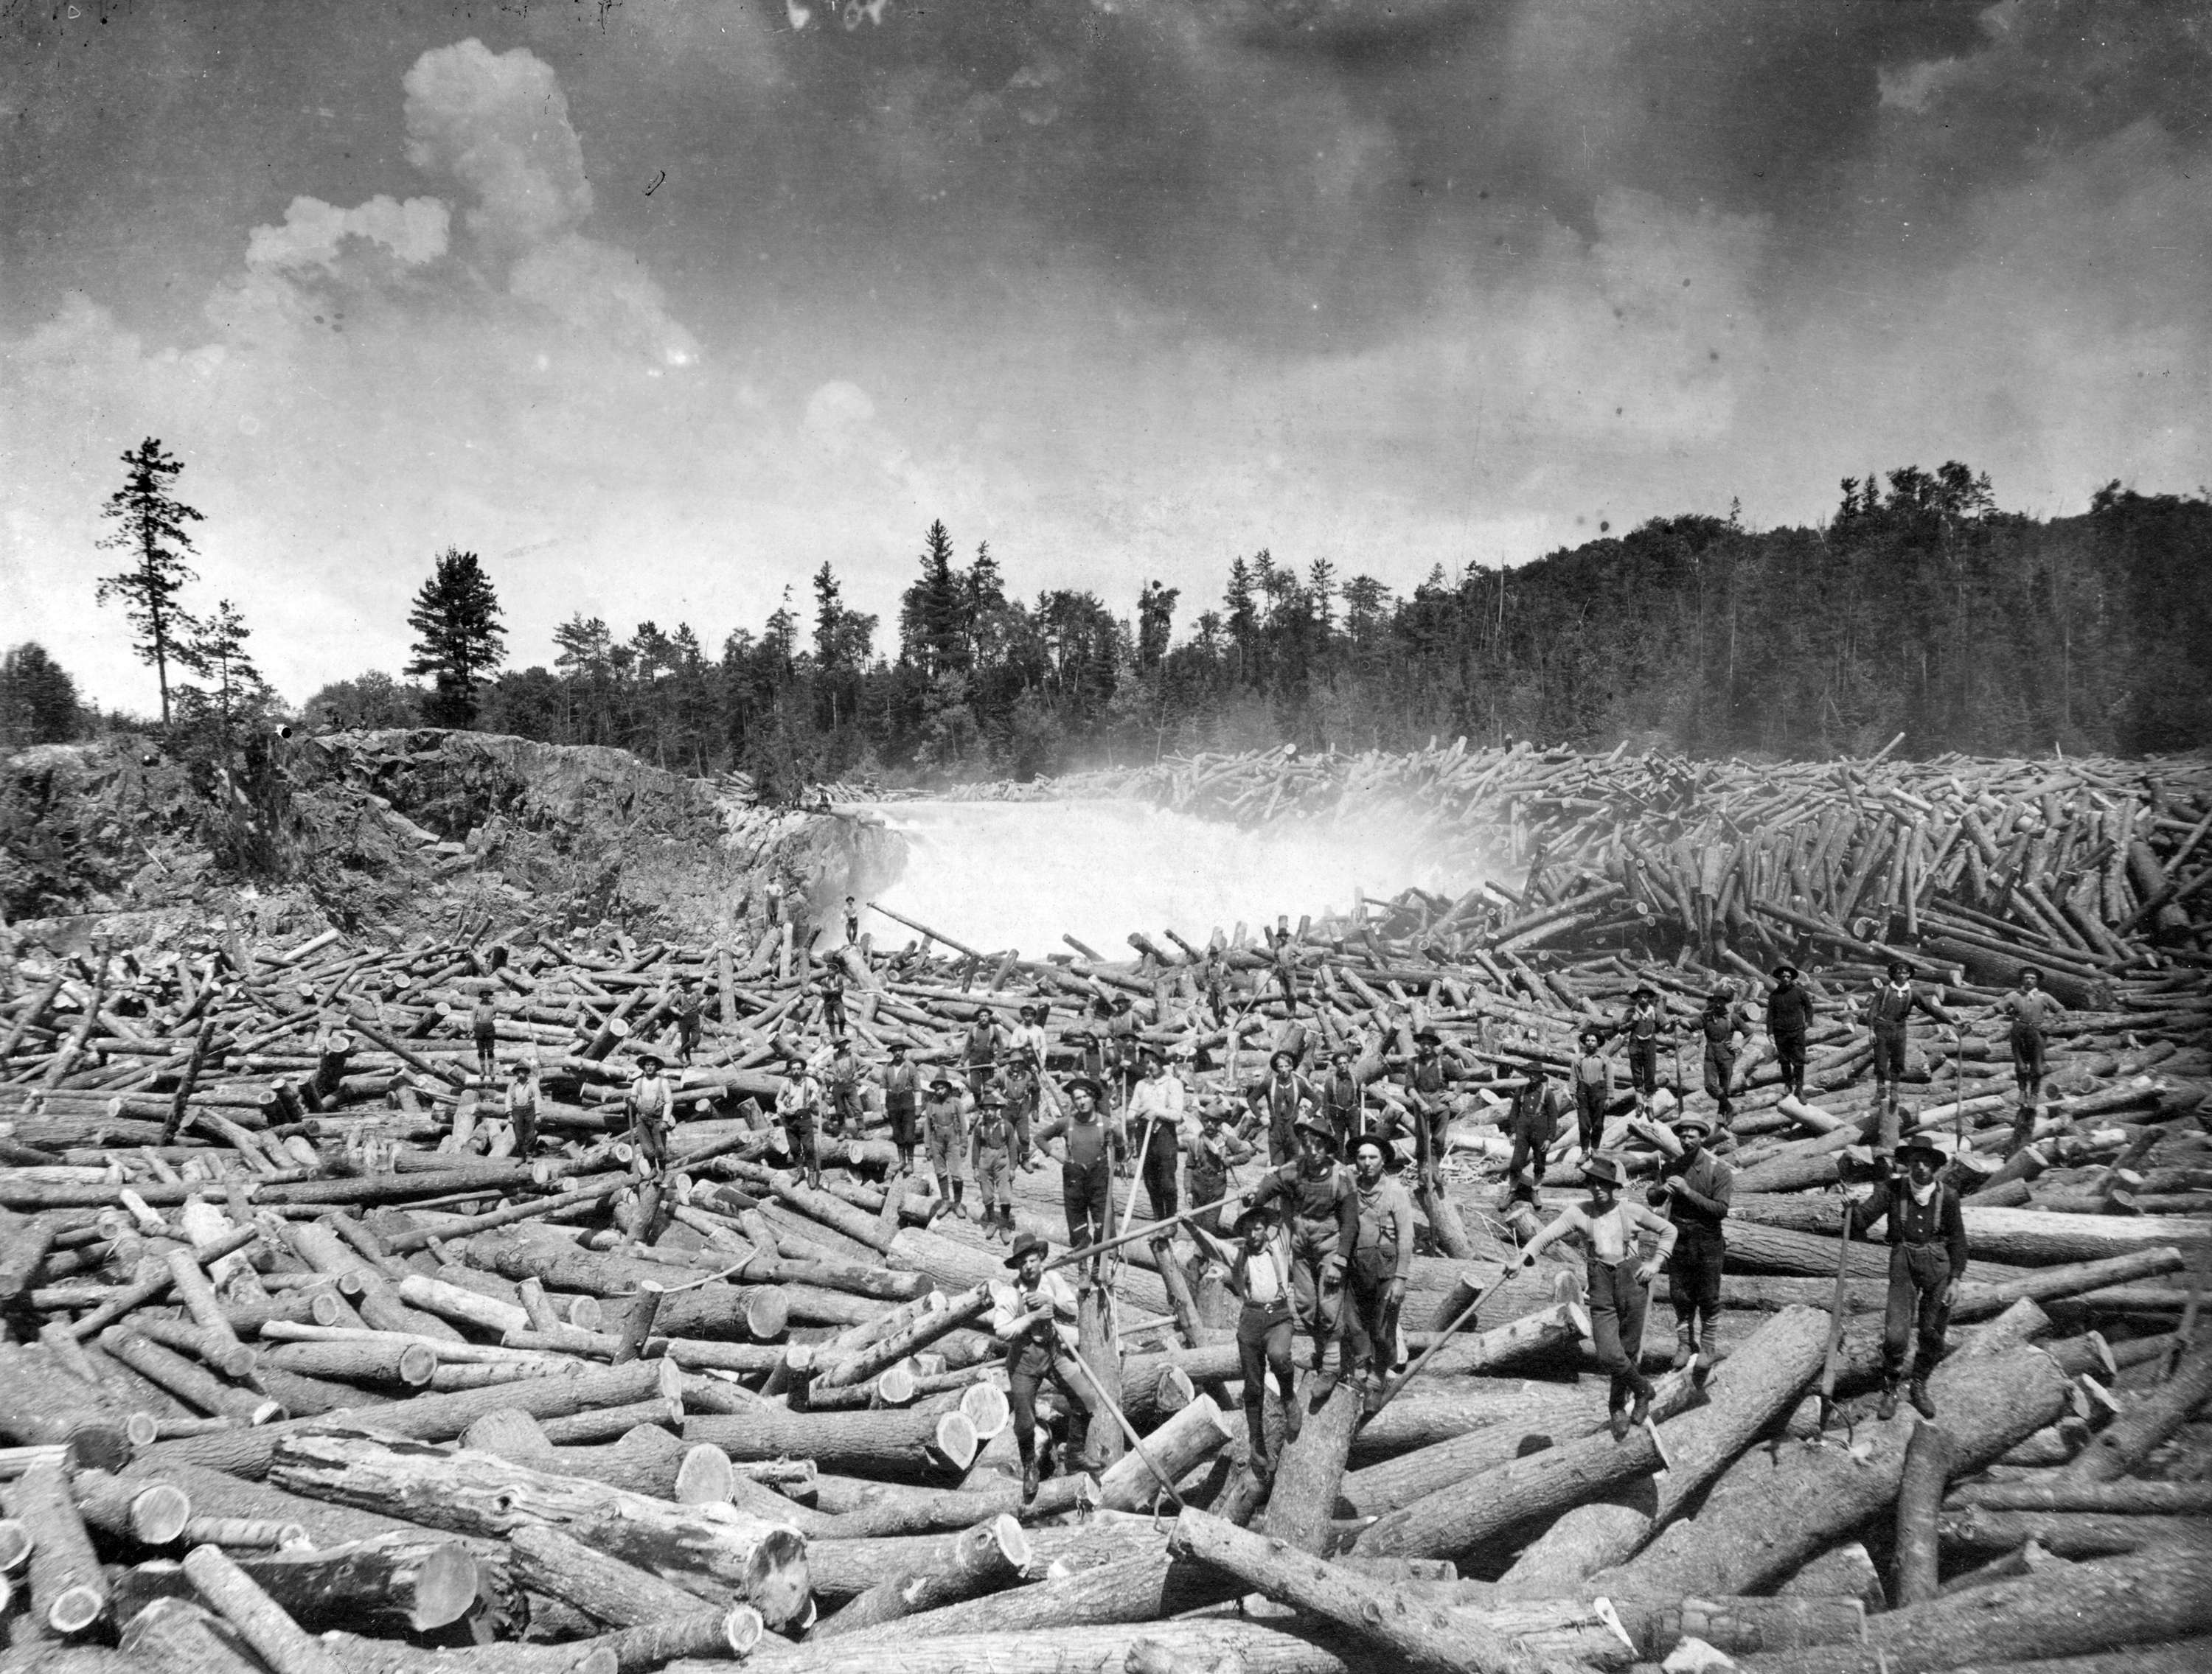
Those of you who have been following us for a long time will doubtless have memories of downtimes extending over days rather than hours. In recent years we have managed to, for the most part, eliminate these terribly long downtimes. On July 15th we were inaccessible to players for 699 minutes, which is slightly longer than the downtimes that occurred on 2nd and 3rd of June 2013, immediately prior to the Odyssey deployment (which itself incidentally incurred a 342 minute downtime due to long running tiericide scripts). Prior to that, Incarna in 2011 saw us down for 963 minutes, but really was the last of the very long deployments that followed our 6-month release cadence. Right now, if we simply auto-reboot without deploying anything, we can be confident that that will take approximately 7 minutes, and if we are deploying we can normally expect to be up well within our allotted 30 minute downtime.
Startup
The TQ cluster is made of approximately 250 server nodes. To start up the cluster, all the nodes must perform a coordinated sequence of actions. These actions include assigning IDs to each node, making network connections between every pair of nodes, allocating which solar-systems will run on which node, and loading up the necessary data to allow each node to perform its tasks. Node tasks may include handling the region for a market, or a set of corps/alliances, or skill training for a set of characters.
During the start-up sequence, the cluster progresses through several stages. The cluster will not advance to the following stage until all nodes have reported that they have completed the current stage's actions. It begins at stage -4 and continues up to stage 0. Once all nodes have reported in at stage 0, the cluster is considered ready. One master node is chosen to orchestrate this sequence, nicknamed Polaris. The Polaris node is responsible for checking the stage of all other nodes, and sending out instructions to advance to the next stage once the appropriate conditions are met.
-4: The node has started running and we have a connection to the database
-3: The node has successfully opened a network connection to every other node
-2: Address cache has been primed, this is basically the routing table so each node knows what every other node is supposed to be doing
-1: All startup services have completed their initialization and now some pre-loading of data has begun (market, solar systems etc)
0: The node has been told the cluster is ready, all startup data is loaded and services are ready to receive requests
Incident
When we took the server down on July 15th to deploy the first follow up patch to Aegis Sovereignty, we expected no incident – the test servers that we had previously applied the update to had started correctly and were behaving normally, and we assumed it would be a very standard 15-20 minute deployment. Our first snag was our deployment tool taking a very long time to deploy the server package, eventually erroring out and being rebooted shortly before 11.30. At this time we messaged a delay in startup but still didn’t expect anything out of the ordinary – tools can occasionally just fail, timeouts happen and we simply deployed again, this time successfully. Server startup was first attempted at 11.42, by 11.46 we had 12 (out of ~250) nodes reporting that they were stuck, preventing a successful startup. Not to be deterred, our first port of call was the oldest trick in the IT book – “turn it off and on again”.

Startup went faster this time around, but we were still faced with 41 nodes stuck in their “-1” state. We decided to set VIP access on the server, meaning that only accounts with special developer roles can access the server when it’s online, and do a full do-over of the deployment to rule out any locks, conflicts or human error from the first time around. All our suspicions at this time were directly on the environment as being the cause, as the code was working on a test server and none of the data was giving off any red flags.
Unfortunately, 2 startups later, we were no closer to having a healthy server online, so it was time to call in the cavalry. EVE programmers joined Operations for further investigation into the code side of things, meanwhile some other developers discussed the feasibility and likely outcome of a rollback to the previous day’s build. A rollback had not been considered up to this point as nothing had indicated that the code was an issue, but since we had some time while the investigation was ongoing, we figured we would test it.
While EVE programmers worked through the start-up logs, attempting to figure out what errors might be related to the cause of the start-up issues, Ops worked through a number of hardware/OS checks, as we had made various infrastructure changes in the previous days. As the Polaris node is critical to orchestrating the start-up sequence, the server normally hosting the Polaris node was removed from the cluster. A node on a different physical server was chosen as a replacement. This change was an attempt to eliminate any hardware/software failures that might be specific to a single server, however no improvement was seen in the next start-up attempt. Our test of the rollback was confirmed to work, but we still didn’t believe the code to be the issue – we were firm that it was either related to the build package itself, data, or the environment.
Testing further, we decided to deploy our original TQ build to the Singularity test server. The reasoning behind this was that Singularity has DUST data and services, whereas Multiplicity, our EVE Hotfix/Release test server, does not. We considered this an unlikely scenario at best, but worth doing, and Sisi did indeed start up fine. We noticed in out monitoring tools that the EVE process was trying to communicate out on an extra network card, IBM USB Remote NDIS Network Device, that was in the IBM blade servers. This network interface is used to manage the server via IMM (Integrated Management Module) or AMM (Advanced Management Module). Through this interface you can manage the server on a low level such as updating the firmware through the OS or getting information on the server. The network interface gets assigned a Windows self-signed IP address that is not used in public IP version 4 space and has no routes to our private networks in the datacenter. Although the EVE process is not supposed to use this network interface, to eliminate the possibility that it could cause issues we went ahead and disabled the interface. On the TQ side, we disabled CREST and associated services to rule out everything we could, made a change to the name of the server package so we could ensure there hadn’t been bad overwrites, and tried again. At 14.21 startup had completed, with 53 nodes stuck at “-1” status.
We tried a few long shots over the next hour as developers continued their investigations. Our next idea came at 15.29, when EVE Dev presented a plan to empty some of the new sovereignty records from the database, backing them up in temporary tables, to see if that data was the cause of the issue. The reasoning behind this was that at gameplay level, the most significant difference between start-up on Tuesday and on Wednesday was that on Tuesday all the sovereignty structures were in a fresh state, before any campaigns or vulnerable windows had been generated. In reaction to this, CCP Lebowski and other QA began generating tremendously large amounts of Entosis campaigns on Singularity, to see if they could cause a comparable spike of errors, or a failed startup. Despite loading Singularity with almost double the amount of sovereignty reinforcement events and vulnerability windows as TQ, it continued to start up perfectly every time. We had the script tested on Duality by 15.48, confirming it worked as expected, and it was off to TQ with it. The script ran, the tables were confirmed to be empty, and at 16.33 we anxiously watched the progression of the start-up sequence
-4
-3
-2
-1
...
0
She's up!
This was great news. Now we had to figure out why clearing out the reinforcement and vulnerability data allowed the server to start up cleanly.
Opening in this state was not an option, considering we had just effectively deleted a day’s worth of sovereignty campaigns, so investigations continued. By this time, there were around 8 EVE programmers participating in the investigation, with several Operations staff conducting their own investigations in parallel, and practically every QA in the building trying to replicate the issue on Singularity. By 17.10 we made the next change - the vulnerability window data only was re-added to the DB. The next start-up would help indicate if it was this or the reinforcement events that were blocking start-up. We deployed the change, started up successfully, and had a vaguely smoking gun – the presence of campaigns themselves was somehow causing the issue. EVE Dev focused their investigations accordingly. The remaining campaign data was then re-added back to the database.

A theory about what might cause the stuck nodes had been formed: during start-up, the nodes running solar-systems with one or more sovereignty campaigns must talk to the nodes managing the related alliances. One of these queries is to look up the alliance's chosen capital system. According to the design for the new sovereignty system, changes to an alliance's capital system will take several days to come in to effect. During the days following the initial feature deployment we wanted alliances to more easily settle in to these new rules, and so we added a configuration option whereby we could temporarily override the 7-day timer with a much shorter delay.
Our theory was that if these cross-node calls to lookup the alliance capital were interacting with the mechanism for loading configuration data (as used to override the default delay) in a particular way, it could lead to a cross-node deadlock. That is, the solar-system node that loaded the campaign is waiting for the alliance node to respond with the info it needs. Meanwhile the alliance node has loaded the capital configuration settings and is sending an update to that capital solar-system telling it "You are the capital, you should use a +2 defense modifier". The alliance node will not respond to any new requests until the solar-system node acknowledges the updated capital status, but the solar system node will not respond to any new requests until the alliance node answers the campaign query. We submitted a code change that removed the configurable capital delay and should have eliminated the possibility of this causing a deadlock. During the next startup at 18.12 we were met with 51 nodes at “-1” – back to the drawing board (after one quick reboot just in case).
So what did we know by that point?
- Starting up with no campaign data in the DB worked OK on TQ and on all test servers.
- Starting up around 300 campaigns in the DB failed on TQ, but worked OK on all test servers.
- Eliminating cross-node calls related to alliance capitals did not seem to make any difference.
- We needed to do some experiments around loading campaigns on TQ to isolate what point in particular we experienced the problem.
We decided to completely remove campaign loading at start-up. The consequence of this was that the background spawning of command nodes wouldn't happen, but otherwise the sovereignty structures should load up as normal. Note that this is not intended as an actual fix, instead it is to give us a new data point about what conditions cause a successful/failed start-up. This experimental change (Hotfix#2) did indeed get us started up at 19.15, and led us to experiment #3 - what would happen if we now loaded the campaigns, but only after a brief delay, to allow everything else to finish starting up first?
We also tried re-enabling the campaign loading (that we had previously disabled in Hotfix#2), but delayed it and let it run asynchronously to the rest of the start-up. At this point we were hit with some slight snags, with Perforce sync hangs causing delays in our build system, and some unrelated data storage issues, but with every hotfix we were getting closer and closer…

to pizza, which mercifully arrived at 19.48 while our 3rd hotfix was deploying. TQ failed to start up again with this change, which was interesting because in Hotfix#3 we were loading the campaigns independently of the rest of the start-up tasks, and yet loading them was still able to break some nodes.
Reinvigorated by a ping-pong table full of pizza we redeployed Hotfix #2 for more experimentation and LIVE CONSOLE EXPERIMENTS.

Once all nodes were up and we had verified that solar-systems had loaded ok, we opened up a python console on the server, allowing us to issue commands and observe the results in real time. We performed a few checks to ensure that no campaigns were loaded on any nodes. As expected, they all reported that their campaigns were empty. We then requested all nodes to load up the campaigns that they were responsible for. Immediately the cluster started to become slow and unresponsive. After a few minutes, we started to see several nodes die and drop out of the cluster. As this happens, any solar systems on those dead nodes get remapped to remaining live nodes. We were now down to around 200 nodes out of 250. We then instructed the cluster to run the campaign loading sequence again. What we expected to see was each node log out the campaigns it knows about, and then report that no further campaigns required loading (as they were all in memory). What actually happened is that again the cluster became unresponsive for a few minutes, and when everything settled down, a bunch more nodes had also died. This was most strange, as all that should have happened was the nodes logging out some info, as they had nothing new that required loading. A thought occurred: maybe it wasn’t actually the campaigns themselves that were causing the issues - what if it related to the logging that happens around the campaigns? As the cluster was now in a bad state due all the dead nodes, we requested a reboot (staying on Hotfix#2) for some more tests.
Via the console we modified the campaign loading functions so that they performed the load-from-DB operations normally, but all their logging operations were disabled. We then repeated the same test from above - instruct all nodes to load their campaigns. This command completed almost instantly, and the cluster remained perfectly healthy. WTF! Further checks indicated that all campaigns had indeed successfully loaded. We then repeated the second-time load test, again using the loading functions with the disabled logging. This also completed instantly, reporting that no new campaigns needed loading.
As a final test, we then switched the disabled logging back on, and issued another load-campaigns instruction. The cluster then regressed back to the earlier behaviour, showing excessive delays as nodes began to die off. We seemed to have found the culprit (even if we didn’t know exactly how/why!). For some reason, the logging channel used by the campaign system on TQ appeared to degrade node performance to the point that some of those nodes would actually drop out of the cluster.
Note: These channels refer to the logs used by developers for testing feature operation and investigating defects. They are independent of the activity logs that you might see in your character wallets, for example, or that GMs use in their customer service duties.
Hotfix #5 was requested at 21.48, containing what we believed would mitigate the issue. All logging within the campaign system was entirely removed, but otherwise the code was mostly unchanged. If this change led to a successful startup, we would be close to being able to re-open TQ. It was deployed to TQ at 22.07. We had a good startup by 22.22 and able to begin VIP checks to ensure that no sovereignty data had been damaged by our experiments. One problem was found with a duplicate campaign, but that was easy enough to clean away. We brought CREST back online at 22.38 and lifted VIP to open TQ to all players at 22.41.
Aftermath – Monday 20th July
Following our previous adventures in clusters failing to start, we needed to get to the bottom of why one particular log channel (the one used by sovereignty campaigns) on one particular server (Tranquillity) could cause extreme server stability issues. Therefore we scheduled some VIP time on TQ where we could perform a few experiments. Our goal was to find the simplest possible code that we could execute that would reproduce the symptoms in order to aid further investigations. We connected to a python console on a TQ node - from the console we could interactively 'poke at things' to see what we could break. (Prior to this, we had gone through the same steps on the Singularity and Duality test servers, and all tests had completed without triggering the error condition).
We had prepared a series of escalating steps that we intended to follow. Each one would progressively add more factors in to the mix, until the issue could be hopefully be reproduced. As it turned out, we didn't need to go very far at all! Here is what happened:
Firstly we had two logging channels - a generic channel, and then the specific channel used within the sovereignty system for logging campaign activity. We then validated that both channels were working, by executing the following code on a single node.
|
1 2 3 4 5 6 7 8 |
# generic_logger is a reference to a generic log channel # campaign_logger is a reference to the log channel used by sovereignty campaigns # Step 1a: Assert that output to the generic logger works correctly generic_logger.warn('The quick brown fox jumps over the lazy dog') # Step 1b: Assert that output to the campaign logger works correctly campaign_logger.warn('The quick brown fox jumps over the lazy dog') |
As we run this we were also observing the log output in real time via Splunk. We did indeed see each line appear once.
Next we run step 1a on all 250 nodes in parallel at the same time. Immediately we see 250 entries pop up on the Splunk display. Then we do the same for step 1b, and see the same result - each node logs one instance of the line, and each line shows it came via the campaign channel.
So far so good. Now let's log a bit more data, but nothing that should cause any problems, right? Right? Hmm...
|
1 2 3 4 5 |
# Step 2a: Log the same line 500 times per node, on the generic log channel [generic_logger.warn('The quick brown fox jumps over the lazy dog') for i in range(500)] # Step 2b: Log the same line 500 times per node, on the campaign log channel [campaign_logger.warn('The quick brown fox jumps over the lazy dog') for i in range(500)] |
For those not familiar with Python, line 2 will loop 500 times, outputting the warning message once per loop via the generic log channel. Line 5 does the same thing, but to the campaign log channel.
First we ran step 2a on all nodes in parallel. The command completed instantly, and we saw a spike of 125,000 lines (250*500) on the Splunk graph. That might seem like a lot of logging, but it isn't anything the system can't handle, especially in small bursts like this. Next we ran step 2b in the same way. This was where something curious happened. The correct number of log lines did show up in Splunk (The logs do show something!), but the command did not appear to return as immediately as it did for step 2a. In fact it took a few minutes before the console became responsive again, and the returned data indicated that several nodes did not respond in time. Looking over the status of the cluster, those nodes were now showing as dead. Somehow this innocent log line had managed to cause these nodes to time-out and drop out of the cluster.
Well that was easier than we thought! We didn't even need to start doing anything with campaigns or the database to reproduce the dead cluster. When a developer cannot rely on simple logging actions to not kill his production server, he is going to have a bad day. Much like we did on Wednesday 15th. Having isolated the problem down even more, we restarted TQ and then gave the go ahead to drop VIP and opened up as normal.
As mentioned on a few occasions in the time-line above, we had never seen this happen on any other test server before or since. There is something unique to the way that TQ operates (or is configured). Investigations are continuing to try to track down why this logging behaviour happens only on TQ, and only on specific log channels. We know that TQ certainly operates at different scale in terms of the amount of hardware, but so far other experiments have suggested that this is not simply a matter of number of nodes. The investigation continues…